MHB Laplace / inverse laplace transform

goohu
Messages
53
Reaction score
3
View attachment 9453

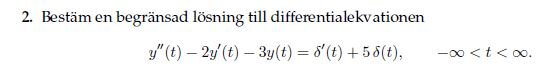
Problem: Find a (limited?) solution to the diff eq.

View attachment 9454
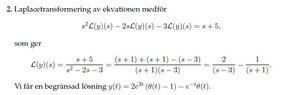
At the end of the solution, when you transform $$\frac{-1}{s+1} + \frac{2}{s-3}$$
why doesn't it become $$-e^{-t} + 2e^{3t} $$, t>0 ?
 

Attachments

  • prob.JPG
    prob.JPG
    6 KB · Views: 164
  • Sol.JPG
    Sol.JPG
    11.9 KB · Views: 159
Physics news on Phys.org
That would be correct if the right hand side of the equation were 0. But the delta functions on the right mean that those are correct only for x greater than certain values so the step functions are needed.
 
What values are those and how are the step functions used?
 
Do you know what "\delta(x)" and "\delta'(x)" mean?
 
There is the following linear Volterra equation of the second kind $$ y(x)+\int_{0}^{x} K(x-s) y(s)\,{\rm d}s = 1 $$ with kernel $$ K(x-s) = 1 - 4 \sum_{n=1}^{\infty} \dfrac{1}{\lambda_n^2} e^{-\beta \lambda_n^2 (x-s)} $$ where $y(0)=1$, $\beta>0$ and $\lambda_n$ is the $n$-th positive root of the equation $J_0(x)=0$ (here $n$ is a natural number that numbers these positive roots in the order of increasing their values), $J_0(x)$ is the Bessel function of the first kind of zero order. I...
Are there any good visualization tutorials, written or video, that show graphically how separation of variables works? I particularly have the time-independent Schrodinger Equation in mind. There are hundreds of demonstrations out there which essentially distill to copies of one another. However I am trying to visualize in my mind how this process looks graphically - for example plotting t on one axis and x on the other for f(x,t). I have seen other good visual representations of...

Similar threads

Replies
7
Views
5K
Replies
17
Views
3K
Replies
1
Views
3K
Replies
2
Views
2K
Replies
5
Views
3K
Back
Top