Magnetic field produced by linear current in COMSOL

Click For Summary
SUMMARY

The discussion centers on discrepancies in magnetic field values produced by a linear current in COMSOL, specifically comparing results from COMSOL 5.5 and COMSOL 3.5. The user reports a magnetic field strength of 0.3 T at 1 mm from a 10 A current in a 0.45 cm wire, which significantly exceeds the theoretical value of 0.002 T as predicted by Ampere's law. The user has confirmed that 2D simulations align with theoretical expectations, while 3D simulations do not, prompting inquiries about boundary conditions and the influence of wire length on magnetic flux density.

PREREQUISITES
  • Understanding of Ampere's law and magnetic field calculations
  • Familiarity with COMSOL Multiphysics, specifically versions 5.5 and 3.5
  • Knowledge of boundary conditions in electromagnetic simulations
  • Basic principles of magnetic flux density and its behavior in different geometries
NEXT STEPS
  • Investigate COMSOL Multiphysics boundary condition settings for 3D simulations
  • Learn about the differences in electromagnetic modeling between COMSOL versions 3.5 and 5.5
  • Explore the effects of wire length on magnetic field strength in linear current scenarios
  • Research the expected shape of magnetic flux in various geometrical configurations
USEFUL FOR

Electrical engineers, physicists, and simulation specialists working with electromagnetic fields and COMSOL Multiphysics who seek to understand and troubleshoot discrepancies in simulation results.

Caleydos
Messages
4
Reaction score
0
TL;DR
Issue with COMSOL 5.5 when trying to calculate the magnetic field produced by linear current in 3D
Hello,

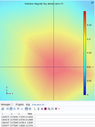
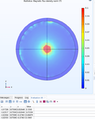
I have used an edge current of 10 A through a 0,45 cm (lenght) wire inside an air sphere. The thing is that, according with Ampere law, the magnetic field (B) produced at a 1 mm of distance from the wire shall be 0,002 T, and I am obtaining much higher values in this simulation (around 0,3 T at his point).

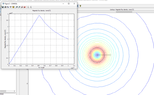
I have done it in 2D and result is OK, according with theoretical values, but I do not know why in 3D it changes. Any idea please?

Many thanks in advance
 

Attachments

  • Esfera 1 m de radio zoom.png
    Esfera 1 m de radio zoom.png
    56.5 KB · Views: 185
Engineering news on Phys.org
Can you post a picture of the geometry in 2D and in 3D?
 
Sure! I attach them here. Thanks a lot!

First one is the 3D model (lateral view), showing the value of the magnetic flux density in COMSOL 5.5 (this value do not matches with theoretical)

The second one is 2D in COMSOL 3.5, this value really matches with theoretical
 

Attachments

  • Flujo campo en modelo 3D (esfera 20 cm). 0,1 T a 2 cm del centro del conductor.png
    Flujo campo en modelo 3D (esfera 20 cm). 0,1 T a 2 cm del centro del conductor.png
    42.5 KB · Views: 167
  • Magnetic Flux density at 1mm (2mT).png
    Magnetic Flux density at 1mm (2mT).png
    41.1 KB · Views: 198
There is something strange going on, for instance:
Flujo campo en modelo 3D (esfera 20 cm). 0,1 T a 2 cm del centro del conductor.png


Check the boundary conditions.
 
Thanks a lot for your reply.

This is one of the things that I supossed in the beginning, but I made the boundary sphere wider and the result is the same (see attached). It seems the magnetic flux shown in the boundary layer is debt to the sphere is very small. Any other idea?
 

Attachments

  • Magnetic flux density long wire 10 amps (0.5 T at 1mm).png
    Magnetic flux density long wire 10 amps (0.5 T at 1mm).png
    18.7 KB · Views: 156
I have tried modifying the length of the wire, magnetic flux should remain the same, but it isn´t. It seems the longer wire produces more flux at 1mm (it makes no sense).

On the other hand, I do not understan why this shape in the magnetic flux, it should be purely circular.
 

Attachments

  • Magnetic flux density long wire 10 amps (0.5 T at 1mm).png
    Magnetic flux density long wire 10 amps (0.5 T at 1mm).png
    18.7 KB · Views: 153
  • Magnetic flux density very long wire 10 amps (0.8 T at 1mm).png
    Magnetic flux density very long wire 10 amps (0.8 T at 1mm).png
    62.8 KB · Views: 138
Most likely this can only be answered by an "old timer". I am making measurements on an uA709 op amp (metal can). I would like to calculate the frequency rolloff curves (I can measure them). I assume the compensation is via the miller effect. To do the calculations I would need to know the gain of the transistors and the effective resistance seen at the compensation terminals, not including the values I put there. Anyone know those values?

Similar threads

Replies
5
Views
4K
  • · Replies 14 ·
Replies
14
Views
5K
Replies
17
Views
2K
  • · Replies 1 ·
Replies
1
Views
1K
  • · Replies 1 ·
Replies
1
Views
3K
Replies
8
Views
2K
  • · Replies 7 ·
Replies
7
Views
2K
  • · Replies 7 ·
Replies
7
Views
2K
  • · Replies 37 ·
2
Replies
37
Views
4K
Replies
4
Views
1K