SeannyBoi71
- 84
- 0
Hey all, I am plotting some data using MATLAB and have a question.
Basically, this is what I'm trying to do. I am calling a bunch of data from Excel, plotting this data in MATLAB (it gives me two lines), and then calculating the polyfit values for each line so I can find the equation y = mx +b for each one. I have no problem Doing all of this, but what I want to do next is display the polyfit data in the legend of the graph. I'm confused if this is possible with the legend function.
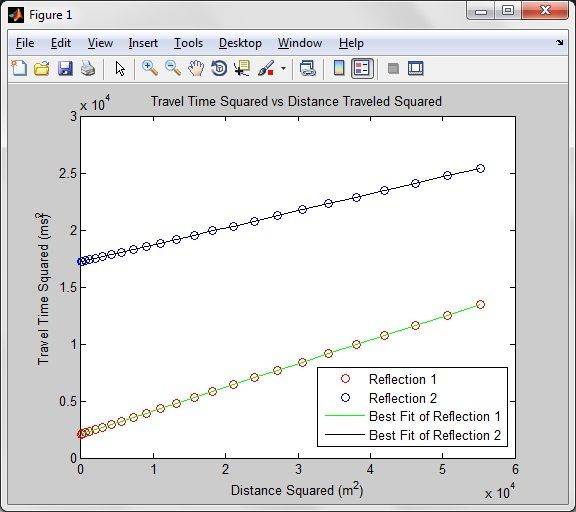
So in other words where it says 'Best Fit of Reflection 1' and 'Best Fit of Reflection 2' I want to somehow place the data calculated by polyfit in the form y = mx +b. Any suggestions? Thanks in advance.
Basically, this is what I'm trying to do. I am calling a bunch of data from Excel, plotting this data in MATLAB (it gives me two lines), and then calculating the polyfit values for each line so I can find the equation y = mx +b for each one. I have no problem Doing all of this, but what I want to do next is display the polyfit data in the legend of the graph. I'm confused if this is possible with the legend function.
So in other words where it says 'Best Fit of Reflection 1' and 'Best Fit of Reflection 2' I want to somehow place the data calculated by polyfit in the form y = mx +b. Any suggestions? Thanks in advance.
 I am pretty proficient with Excel and have only recently started using Matlab, so I was trying to familiarize myself a little bit more with graphing this way.