WMDhamnekar
MHB
- 382
- 31
Hi, Hi,
Author said If we look at the graph of $ f (x, y)= (x^2 +y^2)*e^{-(x^2+y^2)},$ as shown in the following Figure it looks like we might have a local maximum for (x, y) on the unit circle $ x^2 + y^2 = 1.$
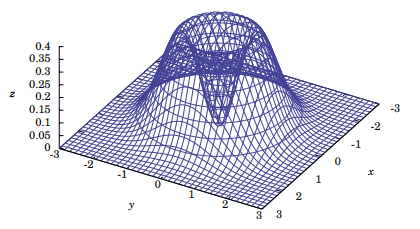 But when I read this graph, I couldn't guess that the stated function have a local maximum on the unit circle $ x^2 + y^2=1$
1)I want to know what did author grasp in the above figure which compelled him to make the aforesaid statement?
2) How to plot this function in 'R' or in 'GNU OCTAVE' or in any graphing calculator ? Is it easy to plot $f(x,y)= (x^2+y^2)*e^{-(x^2+y^2)} ?$
Author said If we look at the graph of $ f (x, y)= (x^2 +y^2)*e^{-(x^2+y^2)},$ as shown in the following Figure it looks like we might have a local maximum for (x, y) on the unit circle $ x^2 + y^2 = 1.$
1)I want to know what did author grasp in the above figure which compelled him to make the aforesaid statement?
2) How to plot this function in 'R' or in 'GNU OCTAVE' or in any graphing calculator ? Is it easy to plot $f(x,y)= (x^2+y^2)*e^{-(x^2+y^2)} ?$
Last edited: