Astro Student
- 19
- 7
Hello everybody! Long-time lurker and second-time posting. I'm working on a project for my math class, and I'm trying to plot the orbits of the planets using vectors. I've chosen to use MATLAB because I am decently familiar with it. I've used the formulas described in this post here to get my function for the program, and this website here for the data by clicking on the names of each planet and scrolling down to the "orbital elements" section.
For some reason, things look quite a bit off. Here's a screenshot of what I mean:
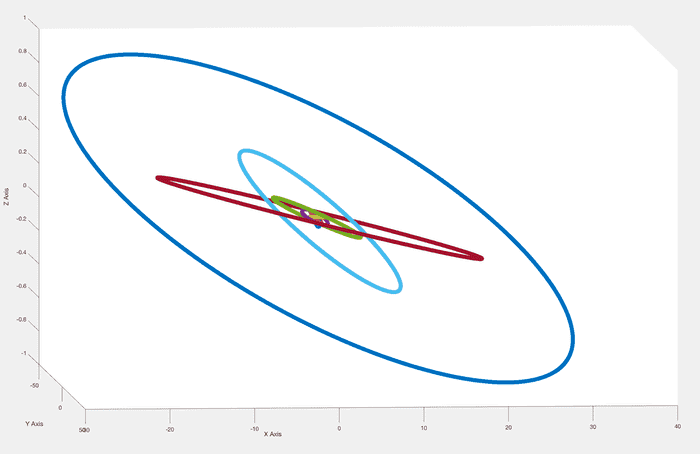
The planes of the orbits just don't seem like they are very similar at all! I don't recall them ever being like that.
Along the x-y plane, however, things seem to be going great:
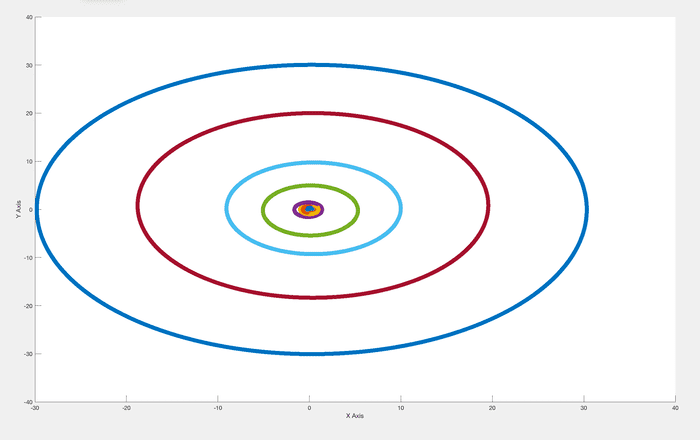
As seen here, my problem seems to be MOSTLY with the terrestrial planets. Earth, in orange, is pretty messed-up looking. Jupiter, in green, is on a similar plane to Saturn, Uranus, and Neptune otherwise.
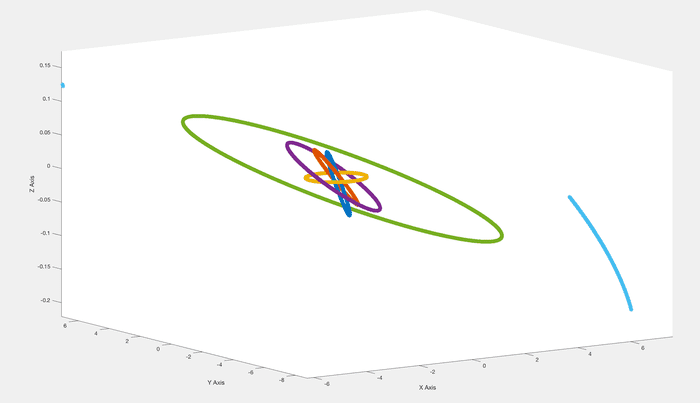
As far as I can tell, I've done everything correctly. If anybody has any ideas at all or can help me, please let me know! Thanks.
Here's my code:
For some reason, things look quite a bit off. Here's a screenshot of what I mean:
The planes of the orbits just don't seem like they are very similar at all! I don't recall them ever being like that.
Along the x-y plane, however, things seem to be going great:
As seen here, my problem seems to be MOSTLY with the terrestrial planets. Earth, in orange, is pretty messed-up looking. Jupiter, in green, is on a similar plane to Saturn, Uranus, and Neptune otherwise.
As far as I can tell, I've done everything correctly. If anybody has any ideas at all or can help me, please let me know! Thanks.
Here's my code:
Code:
%Graphs!

%Define Mercury's parameters
a(1) = 0.38709893; %semi-major axis
e(1) = 0.20563069; %eccentricity
i(1) = 7.00487 * (pi/180); %inclination relative to ecliptic
inv(1) = 6.34 * (pi/180); %inclination relative to invariable plane
w(1) = 77.45645 * (pi/180); %argument of periapsis
o(1) = 48.33167 * (pi/180); %longitude of ascending node

%Define Venus' parameters
a(2) = 0.72333199;
e(2) = 0.00677323;
i(2) = 3.39471 * (pi/180);
inv(2) = 2.19 * (pi/180);
w(2) = 131.53298 * (pi/180);
o(2) = 76.68069 * (pi/180);

%Define Earth's parameters
a(3) = 1.000001;
e(3) = 0.01671123;
i(3) = 0 * (pi/180);
inv(3) = 1.57 * (pi/180);
w(3) = 102.94719 * (pi/180);
o(3) = -11.26064 * (pi/180);

%Define Mars' parameters
a(4) = 1.52366231;
e(4) = 0.09341233;
i(4) = 1.85061 * (pi/180);
inv(4) = 1.67 * (pi/180);
w(4) = 336.04084 * (pi/180);
o(4) = 49.57854 * (pi/180);

%Define Jupiter's parameters
a(5) = 5.20336301;
e(5) = 0.04839266;
i(5) = 1.30530 * (pi/180);
inv(5) = 0.32 * (pi/180);
w(5) = 14.75385 * (pi/180);
o(5) = 100.55615 * (pi/180);

%Define Saturn's parameters
a(6) = 9.53667594;
e(6) = 0.05386179;
i(6) = 2.48599187 * (pi/180);
inv(6) = 0.93 * (pi/180);
w(6) = 92.59887831 * (pi/180);
o(6) = 113.66242448 * (pi/180);

%Define Uranus' parameters
a(7) = 19.18916464;
e(7) = 0.04725744;
i(7) = 0.77263783 * (pi/180);
inv(7) = 1.02 * (pi/180);
w(7) = 170.95427630 * (pi/180);
o(7) = 74.01692503 * (pi/180);

%Define Neptune's parameters
a(8) = 30.06992276;
e(8) = 0.00859048;
i(8) = 1.77004347 * (pi/180);
inv(8) = 0.72 * (pi/180);
w(8) = 44.96476227 * (pi/180);
o(8) = 131.78422574 * (pi/180);

%initialize arrays
x(1,1,1) = 0;
y(1,1,1) = 0;
z(1,1,1) = 0;

%Find the eccentric anomaly for 'plottedPloints' amounts of times
plottedPoints = 10000;
M(1) = 0; %mean anomaly vector
E(1,1,1) = 0; %eccentric anomaly array
iterations = 100; %number of iterations through for E(t)

for t = 1 : plottedPoints %create points for our mean anomaly
    M(t) = (2*pi*t)/plottedPoints;
end

for p = 1 : 8
    for t = 1 : plottedPoints
        E(p,1,t) = M(t);
        for k = 1 : iterations - 1
            E(p,k+1,t) = M(t) + e(p)*sin(E(p,k,t));
        end
    end
end

%Find our position vectors!
for p = 1 : 8
    for t = 1 : plottedPoints
        x(p,1,t) = a(p) * (cos(E(p,iterations,t)) - e(p));
        y(p,1,t) = a(p) * power((1 - power(e(p),2)),0.5) * sin(E(p,iterations,t));
        z(p,1,t) = 0;

        x(p,2,t) = x(p,1,t)*cos(w(p)) - y(p,1,t)*sin(w(p));
        y(p,2,t) = y(p,1,t)*cos(w(p)) + x(p,1,t)*sin(w(p));
        z(p,2,t) = z(p,1,t);

        x(p,3,t) = x(p,2,t);
        y(p,3,t) = y(p,2,t)*cos(i(p));
        z(p,3,t) = y(p,2,t)*sin(i(p));

        x(p,4,t) = x(p,3,t)*cos(o(p)) - y(p,3,t)*sin(o(p));
        y(p,4,t) = x(p,3,t)*sin(o(p)) + y(p,3,t)*cos(o(p));
        z(p,4,t) = z(p,3,t);
    end
end

%i don't know away around this, but i am just creating a bunch of vectors
%since i can't use them directly
for t = 1 : plottedPoints
    mercuryx(t) = x(1,4,t);
    mercuryy(t) = y(1,4,t);
    mercuryz(t) = z(1,4,t);

    venusx(t) = x(2,4,t);
    venusy(t) = y(2,4,t);
    venusz(t) = z(2,4,t);

    earthx(t) = x(3,4,t);
    earthy(t) = y(3,4,t);
    earthz(t) = z(3,4,t);

    marsx(t) = x(4,4,t);
    marsy(t) = y(4,4,t);
    marsz(t) = z(4,4,t);

    jupiterx(t) = x(5,4,t);
    jupitery(t) = y(5,4,t);
    jupiterz(t) = z(5,4,t);

    saturnx(t) = x(6,4,t);
    saturny(t) = y(6,4,t);
    saturnz(t) = z(6,4,t);

    uranusx(t) = x(7,4,t);
    uranusy(t) = y(7,4,t);
    uranusz(t) = z(7,4,t);

    neptunex(t) = x(8,4,t);
    neptuney(t) = y(8,4,t);
    neptunez(t) = z(8,4,t);
end

figure
plot3(mercuryx,mercuryy,mercuryz,'*',venusx,venusy,venusz,'*',earthx,earthy,earthz,'*',marsx,marsy,marsz,'*',jupiterx,jupitery,jupiterz,'*',saturnx,saturny,saturnz,'*',uranusx,uranusy,uranusz,'*',neptunex,neptuney,neptunez,'*')
xlabel('X Axis')
ylabel('Y Axis')
zlabel('Z Axis')