Quantitative Risk Assessment Of buried crude Oil Pipelines

  • #1
DumpmeAdrenaline
78
2
Currently, I am working on a project that necessitates a quantitative risk assessment (frequency analysis and consequence analysis) of buried crude oil pipelines, considering specific hazard scenarios.

Most of the hazard analyses I have come across were conducted on gas pipelines, and there seems to be a limited number of publications that deal with liquids. Moreover, these few studies do not consider crater formation. I have found that the PHAST software considers crater formation, but as a student, the subscription cost is expensive for me.

I was wondering if anyone could recommend any resources or literature that specifically address crater formation in the context of pipeline hazards involving crude oil.

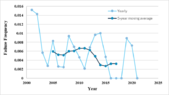
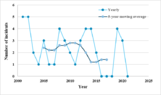
Also, I have been reviewing several research papers and noticed that many of them use databases of historical accidents for their assessments.
Provided the pipeline system requires relevant information regarding the pipeline design and installation, properties of the fluid being transported, and the main conditions in the surroundingsWhile I understand the value of this approach, I have some concerns about its applicability to my study. Specifically, I am unsure how accidents involving pipelines with different pipeline systems are relevant to the parameters I will choose for my study.I am unsure how to draw conclusions from this historical data given these differences.
 
  • Like
Likes DeBangis21
Engineering news on Phys.org
  • #2
In many parts of the US, counties will do multi-risk assessments as part of qualifying for government grants for infrastructure improvements. I don't know if you have the same requirements in your area where you are doing this risk assessment, but if you do, check the county records to see if they have one available to the public that includes a section on the oil pipeline that passes through that county.

I was on committee here locally in Alameda County (in Northern California) a few years ago, and the amount and quality of the work that went into that risk assessment study was amazing. I don't think our full report was available to the public in the end (particularly the sections on terrorism), but hopefully you can find something.
 
  • Like
Likes Astronuc, Vanadium 50, russ_watters and 2 others
  • #3
I tried searching for risk assessments on the US Department of Transportation site, and I found a document on how to perform pipeline risk modeling. I will definitely use it in my report. However, I forgot to clarify that I am using data from a paper that developed a methodology for performing Quantitative Risk Assessment (QRA) for onshore crude oil pipelines in Colombia.

I am having a lot of issues understanding their approach. The reason I am using this paper is that it contains information about the pipeline system, including pipeline design, fluid properties, and operating conditions. However, the Colombian pipeline failure incident reports lack data on the size of the failures. As a result, the paper used data from the report "performance of European cross-country oil pipelines."

The report reported spillage distributions by hole size range, referring to them as no hole, ,split, pinholes, fissures, and ruptures. In the paper, they considered four different failure sizes from each range and assigned them the same frequency as reported in the report. I'm wondering why they didn't consider all pipeline failure sizes, where the equivalent hole size diameter falls between 0 and the pipeline diameter. What if pipeline failures occur at different sizes than the ones considered in the paper? Is it appropriate to use data from database on pipeline failures with a different pipeline system?
 
Last edited by a moderator:
  • #4
In my judgment, the first step is to identify the failure mechanism (or mechanisms). It is important to then articulate the physical process for failure on a fundamental basis, and derive the equations for the process to occur, at least leading up to the critical loading. Sometimes, if data is available, dimensional analysis can be used. Identification of the key dimensionless groups can reduce the number of independent physical parameters involved, and can help map out the regions to be avoided.
 
  • Like
Likes DumpmeAdrenaline
  • #5
Chestermiller said:
In my judgment, the first step is to identify the failure mechanism (or mechanisms). It is important to then articulate the physical process for failure on a fundamental basis, and derive the equations for the process to occur, at least leading up to the critical loading. Sometimes, if data is available, dimensional analysis can be used. Identification of the key dimensionless groups can reduce the number of independent physical parameters involved, and can help map out the regions to be avoided.
After researching for the past few days, I found that internal corrosion is one of the leading types of pipeline failure. I read that crude oil is not corrosive by itself, but crude oil contains water and sediments limited to <0.5 % wt, and the solid particles tend to be encapsulated by a layer of water that may concentrate water on the pipe wall surface. This creates the potential for corrosion to occur if the flow conditions of the pipeline system allow for these solids to settle out. The primary factor that affects internal corrosion in transmission pipelines is flow rate (low velocities). I was thinking of developing a CFD model of the two-phase flow to determine the velocity profile and identify locations where the velocity is lower than the entertainment velocity (the velocity at which water settles out from the crude oil). These locations are highly susceptible to corrosion. However, I am not sure if this approach is correct.
 
  • #7
I have collected data on crude oil incidents from the CONCAWE cross country European oil pipeline. The database includes incidents for 3 types of service: crude, refined products, and heated black products (hot oil) over 1971-2021. However, I have used the data from 2001-2002 because as this period includes pipelines that were not previously accounted for in their active pipeline network inventory, making it more representative.


The incidents in the database provide information such as pipe diameter, age of pipe, gross volume and net volume, the facility type (undeground, above ground, and pump station), method of detection, the cause of the spill (mechanical, operational, corrosion, third-party activity, or theft), and contamination in the land (m2) and water (yes/no).

Using the pipeline length and assuming that the age distribution for crude oil pipelines follows the same profile as the total pipeline network (crude, refined products, Hot oil), I calculated the weighted mean age for each year and the pipeline exposure, which is the product of pipeline length and exposed duration. I realized that the crude oil pipeline length remained nearly constant (10,000 km) during the considered period, while the pipeline itself progressively aged over time.

Considering the progressive aging of the pipeline, it is possible that aging could be the contributing factor to the absence of a clear trend in the number of incidents and the failure frequency (calculated as the number of incidents divided by the pipeline exposure) with time?. To remove the impact of random fluctuations, I had to employ a moving average technique.


plHegLrzXl3zWi-Ne0nC_xR73sPNggX_U0vvdHmwqzmgNPnUBI.png

FgjwDxuaFksUkIntiJWS1npwFf5jMAi3Whs7SAD5wGTe_BC_U4.png
 

Attachments

  • 1711309226401.png
    1711309226401.png
    14.7 KB · Views: 5
  • 1711309282268.png
    1711309282268.png
    9.8 KB · Views: 7
  • #8
See the Abstract of the following:

A review of quantitative risk assessment of onshore pipelines​

https://www.sciencedirect.com/science/article/abs/pii/S0950423016302601
This paper reviews and analyses frequency and consequences of failure of onshore pipelines transporting oil, refined products and natural gas. Generally accepted risk levels are indicated and a desirable risk range is proposed.

Pipeline failure statistics from the United States (US), Canada, Europe and Brazil are compared. Failure rates for internal and external corrosion, human action and natural forces are analyzed and the expected failure rate for each failure mechanism is indicated. The effects of relevant construction and environmental factors on the failure frequency are studied and mean trends are obtained. Furthermore, the sizes of the holes indicated at different databases are compared and a typical distribution of failure sizes is proposed for each mode of failure. Finally, the frequency of ignition after a loss of containment is studied for gas and liquid pipelines.

Historical data on consequences of the accidental loss of containment of onshore pipelines is reviewed.
Some resources are cited in the article.

One can find information at the American Petroleum Institute, www.api.org
e.g., https://www.api.org/products-and-services/pipeline-sms-assessment-program

Oddly, the American Institute of Physics publishes conference proceedings that include QRA

Quantitative risk assessment for external corrosion of buried onshore pipeline by using direct examination​

https://pubs.aip.org/aip/acp/articl...sessment-for-external?redirectedFrom=fulltext

One might be able to obtain copies through one's university library or department. It may be worthwhile to buy a few articles.
 

Similar threads

  • General Engineering
Replies
20
Views
2K
  • Engineering and Comp Sci Homework Help
Replies
1
Views
2K
  • STEM Academic Advising
Replies
2
Views
2K
  • Sticky
  • Feedback and Announcements
Replies
2
Views
495K
Back
Top