Transistor Load line doesn't intersect characteristic curves....

Join the discussion
Ask a follow-up here, or get your own question answered by working scientists, mathematicians and engineers — people, not an autocomplete.
Real named experts · corrections over time · the nuance an AI answer skips
3 replies · 2K views
nfi
Messages
1
Reaction score
0
Homework Statement
Plot the characteristic curves of a BC108 Transistor
Relevant Equations
Rb=100k, Rc=1k, VCC=15V
Hello,

I've carried out an experiment to plot the characteristic curves (Ic vs Vce) for a BC108 transistor and then attempted to find where the load-line intersects those curves. Below are my results:
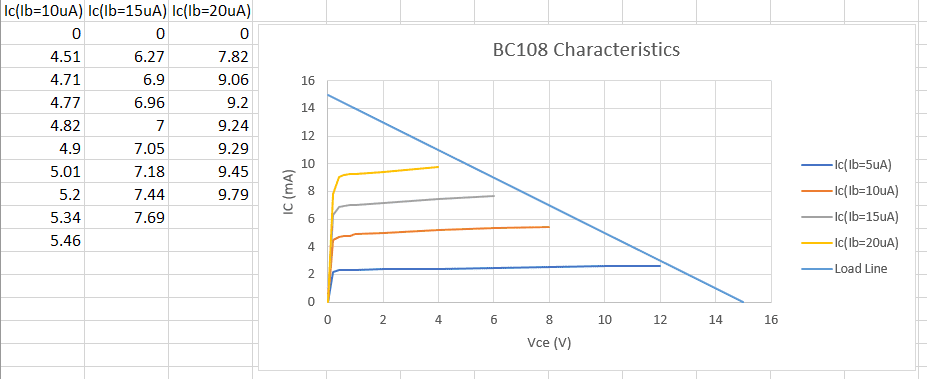
BC108_characteristic_curves.png


...as you can see, the load-line doesn't intersect the characteristic curves at all.

When carrying out the experiment, the values of Ic shown were recorded as Vce was varied from 0V to the final value of Vce shown - it wasn't possible to drive Vce any further for each curve, despite the supply being 15V.

Am I doing something wrong here, or is this to be expected? I was hoping to find the upper and lower value of Ib to design an amplifier, but this isn't going to be possible with these results. Can I just extrapolate by extending the characteristic curves? i haven't tried changing Rc for a smaller value - would this improve the results?

Any helpful suggestions would be very welcome,

Thanks :)
 
Physics news on Phys.org
Are you sure of your arithmetic? 15V/101,000 ohms =?

EDIT: Assume common emitter circuit. Is the Rb the base bias resistor and is there no emitter resistor?
 
Last edited:
I think you've already determined that [itex]V_{CC} = V_{R_C} + V_{CE}[/itex].

In other words, [itex]V_{CE} = V_{CC} - V_{R_C}[/itex]

(This is of course assuming common emitter configuration with the emitter connected directly to ground [[itex]R_E = 0 \ \Omega[/itex]].)

[Edit: By that I mean to say that I don't find anything wrong with your data so far, regarding that.]

In your experiment, I'm guessing that you adjusted the supply voltage between 0 and 15 volts when making the [itex]V_{CE}[/itex] measurements for a given [itex]I_B[/itex].

But if you want each of the characteristics curves to all extend out to 15 V, sometimes you'll have to increase the [itex]V_{CC}[/itex] to be greater than 15 V, to account for the voltage drop across [itex]R_C[/itex], when taking measurements.

[Edit: in other words, I think the problem was stopping your measurements when the [itex]V_{CC} = 15 \ \mathrm{V}[/itex]. I think you need to increase [itex]V_{CC}[/itex] to higher voltages: Increase [itex]V_{CC}[/itex] to whatever it takes to bring [itex]V_{CE}[/itex] up to 15 V, or whatever voltage you want the curves to extend to. (Take care not to burn anything up though.)]
 
Last edited:
  • Like
Likes   Reactions: berkeman
If the resistor values are given as constraints, then the advice that @collinsmark gave above is the way to go.

Here is another tip that you may soon find useful though.
A sometimes non-obvious point is that the Slope of the Load Line is related to the value of Rc.

For instance the maximum Vc is when there is no Collector current. In that case Vc=Vcc, or Vc=15V on the X-axis of your graph.

The minimum Vc is when the transistor is saturated, or full on. The Ic will then be limited by Vcc and the value of Rc (RLOAD). On your graph that is 15mA on the Y-axis. The maximum current follows the usual Ohms Law.

That being said, the Load Line can be moved around on the graph to intersect the curves by changing Vcc (moving the Load Line left or right), or by changing Rc (changing the Load Line slope).

Hope it helps.

Cheers,
Tom

p.s. as long as the transistor maximum voltage and current are not exceeded, and since the curves almost reach the Load Line, many of us would just extrapolate the Curves and call it "Close Enough". (But you have to burn up a few before you learn when you can get away with it!) :oldsurprised:
 
  • Like
Likes   Reactions: collinsmark