Lancelot1
- 26
- 0
Hello all,
I am trying to understand the rational behind the visualization of integration by parts, however I struggle with it a wee bit.
I was trying to read about it in Wiki, this is what I found:
View attachment 7307View attachment 7308
-----------------------------------------------------------------------------------------------------------------------------------------
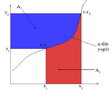
In general I don't understand why this visualization was chosen, but to be more specific on the details, I don't understand why
\[x_{2}y_{2}-x_{1}y_{1}=xy\]
I also don't understand how can one claim an integral to be the area on the left and not under the curve.
I would appreciate it if you guys could explain this to me. I understand how to use integration by parts, I also understand the proof (although wasn't sure: can you always say that an integral of derivative of some function is the function?). I mainly don't get the visualization, and really want to.
Thank you in advance !
I am trying to understand the rational behind the visualization of integration by parts, however I struggle with it a wee bit.
I was trying to read about it in Wiki, this is what I found:
View attachment 7307View attachment 7308
-----------------------------------------------------------------------------------------------------------------------------------------
In general I don't understand why this visualization was chosen, but to be more specific on the details, I don't understand why
\[x_{2}y_{2}-x_{1}y_{1}=xy\]
I also don't understand how can one claim an integral to be the area on the left and not under the curve.
I would appreciate it if you guys could explain this to me. I understand how to use integration by parts, I also understand the proof (although wasn't sure: can you always say that an integral of derivative of some function is the function?). I mainly don't get the visualization, and really want to.
Thank you in advance !