Graphing 3D Parametric Equations on Nspire: Did I Do It Right?

In summary, the conversation discusses graphing parametric equations in 3D and the confusion about the resulting graph. The person who created the graph initially thought it would be more complex and three-dimensional, but it turned out to be a simple surface. The conversation also touches on the concept of curves and surfaces in 3D space.
  • #1
ineedhelpnow
651
0
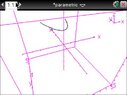
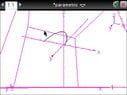
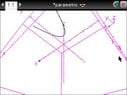
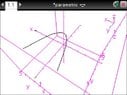
i graphed the parametric equations x=t y=t^2 and z=2 on my nspire in 3d and it came out looking like this

View attachment 3196View attachment 3195View attachment 3194View attachment 3197

(Blush) i have made them pretty so you can see the graph properly

anyways what my question is, is that ( :confused: "is is" ) is the graph supposed to look like that? on a 3d plane? did i do it right?
 

Attachments

  • 09-13-2014 Image007.jpg
    09-13-2014 Image007.jpg
    17.9 KB · Views: 54
  • 09-13-2014 Image008.jpg
    09-13-2014 Image008.jpg
    16.3 KB · Views: 56
  • 09-13-2014 Image009.jpg
    09-13-2014 Image009.jpg
    17.6 KB · Views: 63
  • 09-13-2014 Image010.jpg
    09-13-2014 Image010.jpg
    19.5 KB · Views: 53
Physics news on Phys.org
  • #2
Yes, you would have the graph of $y=x^2$ on a plane parallel to the $xy$-plane, and 2 units above it. :D
 
  • #3
oh so its right?

honestly for a 3d graph...i thought it would have more to it, you know? i thought it would be 3d... with a hollow inside and everything...
 
  • #4
ineedhelpnow said:
oh so its right?

honestly for a 3d graph...i thought it would have more to it, you know? i thought it would be 3d... with a hollow inside and everything...

Sometimes you get curves in 3-space, sometimes you get surfaces. :D
 
  • #5
shouldnt it be like a flat 3d surface though?
 
  • #6
how is y=x^2 though. shouldn't it be x=y^2
 
  • #7
Given: $x=t$, $y=t^2$

$x^2=t^2$ and $y=t^2$

Therefore, $$y=x^2$$
 
  • #8
Hint: if you have one independent variable, it'll be a path or curve in space. If you have two independent variables, it'll be a surface.
 

1. How do I enter 3D parametric equations on Nspire?

To enter 3D parametric equations on Nspire, go to the Graphs menu and select “Parametric”. Then enter the equations in the form of x(t), y(t), and z(t) in the appropriate boxes.

2. How can I view the 3D graph on Nspire?

To view the 3D graph, click on the “View” menu and select “3D Graph” or press Ctrl + G. This will bring up a 3D graph window where you can rotate and zoom in on the graph.

3. How do I change the viewing window for the 3D graph?

To change the viewing window for the 3D graph, click on the “View” menu and select “3D Graph Settings”. From here, you can adjust the viewing window by changing the minimum and maximum values for x, y, and z.

4. Can I add multiple 3D parametric equations on the same graph?

Yes, you can add multiple 3D parametric equations on the same graph. To do so, simply enter the equations in the appropriate boxes and they will all be plotted on the same graph.

5. How do I trace a point on the 3D graph?

To trace a point on the 3D graph, click on the “Trace” menu and select “Trace Point”. Then click on the point you want to trace and it will show the coordinates as well as the t-value for that point.

Similar threads

  • MATLAB, Maple, Mathematica, LaTeX
Replies
5
Views
130
  • MATLAB, Maple, Mathematica, LaTeX
Replies
3
Views
146
  • General Math
Replies
3
Views
1K
  • MATLAB, Maple, Mathematica, LaTeX
Replies
5
Views
3K
  • Calculus and Beyond Homework Help
Replies
4
Views
1K
Replies
7
Views
797
Replies
3
Views
1K
  • Linear and Abstract Algebra
Replies
1
Views
1K
Replies
2
Views
273
  • Introductory Physics Homework Help
Replies
3
Views
750
Back
Top