Displacement as Function of Time Graph Question

73 replies · 13K views · last reply
One of your previous responses was closest to the correct answer (#12).

Chet
 
Chestermiller said:
One of your previous responses was closest to the correct answer (#12).

Chet

Ok, well then this has to be the right answer.
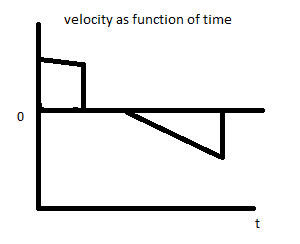
Handwritten graph titled velocity as function of time, with t on the horizontal axis and a zero line marked. The plot shows a short segment above zero that steps down, followed by a straight line falling from zero to below zero, ending in a vertical drop.
 
physicsnobrain said:
Ok, well then this has to be the right answer.

Hand-drawn graph titled 'velocity as function of time' with t on the horizontal axis and a 0 marked on the vertical axis; a short flat segment above zero, then a straight line segment sloping downward below zero.

This doesn't look anything like the graph in response #12.
 
Ok. But at the end it accelerates slow then quickly accelerates. So should it be this?
Hand-drawn graph titled Velocity(m/s) as function of time, with time t on the horizontal axis and a horizontal line at zero; velocity starts positive, decreases slightly, drops abruptly, then goes negative and slopes downward with a steeper final drop.
 
physicsnobrain said:
Ok. But at the end it accelerates slow then quickly accelerates. So should it be this?
Hand-drawn graph titled 'Velocity(m/s) as function of time': a line segment slopes slightly down from the top left, then drops vertically; below the zero line a segment slopes down, then a steeper segment, ending in a vertical drop to a lower point.
No. It should essentially be exactly the same as #12, but with a vertical line coming up from the final point at the right-side, up to the t axis.
 
Chestermiller said:
No. It should essentially be exactly the same as #12, but with a vertical line coming up from the final point at the right-side, up to the t axis.

Could you please explain why it makes that bend in the right hand side of the graph?
 
physicsnobrain said:
Ok, well then this has to be the right answer.
You are allowed to say that only once! :smile:

Hand-drawn graph titled 'velocity as function of time', with velocity on the vertical axis and t on the horizontal axis. A flat segment sits above zero, then a vertical drop to zero, then a sloping line dips below zero and drops vertically to the axis.

Yes, that's about as correct as you are going to manage here. It should sync with the distance vs time graph, so that corresponding times line up. The original distance vs time graph has 3 intervals of roughly equal duration. (That final vertical line is debatable, where you mis-sketched the distance vs time graph.)

I told you this was right quite a few posts back, before you spun off into wild guesses! http://physicsforums.bernhardtmediall.netdna-cdn.com/images/icons/icon6.gif

Now for your acceleration vs time graph ...
 
Last edited by a moderator:
NascentOxygen said:
You are allowed to say that only once! :smile:

Hand-drawn graph titled "velocity as function of time" with t on the horizontal axis and 0 marked on the vertical axis. The line starts above zero, drops slightly, stays flat briefly, then goes down below zero and slopes steadily downward to a point.

Yes, that's about as correct as you are going to manage here. It should sync with the distance vs time graph, so that corresponding times line up. The original distance vs time graph has 3 intervals of roughly equal duration. (That final vertical line is debatable, where you mis-sketched the distance vs time graph.)

I told you this was right quite a few posts back, before you spun off into wild guesses! http://physicsforums.bernhardtmediall.netdna-cdn.com/images/icons/icon6.gif

Now for your acceleration vs time graph ...

Ok, well I will trust you. That other guy told me the other graph is correct so I just got really confused. This graph however actually makes sense so I will go with it as it was my instinct.
 
Last edited by a moderator:
physicsnobrain said:
Ok. But at the end it accelerates slow then quickly accelerates
It might do that, then again it might not. It's difficult to judge from a small sketch. It certainly is not sufficiently obvious that I would agree to it being drawn that way. Neither can I say that the acceleration is fixed and constant here. So the best you can do, without more precise data, is to come up with a rough sketch of what you estimate is happening.
 
Ok. So here is the acceleration chart I'm getting off of the velocity chart. Looks good?

Graph titled 'Acceleration as a function of time', with acceleration on the vertical axis against t on the horizontal axis. The curve sits below the zero line in two rectangular steps: a short low step near the start and a longer, deeper step later.
 
physicsnobrain said:
Ok. So here is the acceleration chart I'm getting off of the velocity chart. Looks good?

Hand-drawn graph titled "Acceleration as a function of time" with a horizontal line labelled 0 on the vertical axis, labelled t on the horizontal axis, showing two rectangular step segments drawn below the zero line.
I'd give you 4 out of 5 for that. :smile:

During the object's travel, there is a moment which could be described as <CRUNCH!>. Where is this point, and how would it show up on the acceleration vs time plot?

I'd leave out that right hand side vertical line. It's doubtful.
 
NascentOxygen said:
I'd give you 4 out of 5 for that. :smile:

During the object's travel, there is a moment which could be described as <CRUNCH!>. Where is this point, and how would it show up on the acceleration vs time plot?

I'd leave out that right hand side vertical line. It's doubtful.

Hmm, I'd say it would show up at both the zero acceleration inbetween and at the end.
 
Your answer is not clear.

If you were that object, at what point(s) in time would you be most likely to suffer bruising? Can you put yourself into that scenario?
 
NascentOxygen said:
Your answer is not clear.

If you were that object, at what point(s) in time would you be most likely to suffer bruising? Can you put yourself into that scenario?

probably at the very end when the graph ends.
 
physicsnobrain said:
probably at the very end when the graph ends.
Explain why.
 
NascentOxygen said:
You are allowed to say that only once! :smile:

Hand-drawn graph titled "velocity as function of time": velocity on the vertical axis against t on the horizontal axis, with 0 marked on the vertical axis. Velocity is positive and nearly constant for a short interval, then drops to zero, stays at zero, then decreases linearly to a negative value and returns to zero.

Yes, that's about as correct as you are going to manage here. It should sync with the distance vs time graph, so that corresponding times line up. The original distance vs time graph has 3 intervals of roughly equal duration. (That final vertical line is debatable, where you mis-sketched the distance vs time graph.)

I told you this was right quite a few posts back, before you spun off into wild guesses! http://physicsforums.bernhardtmediall.netdna-cdn.com/images/icons/icon6.gif

Now for your acceleration vs time graph ...

Hey guys. Please excuse me. Sorry I didn't notice that the zero slope on the right side of the plateau in the distance time graph was continuous. So this present figure is a better representation of the velocity variation than the one I recommended using in post #12.

Chet
 
Last edited by a moderator:
NascentOxygen said:
Explain why.

The object instantly goes from having acceleration then goes to 0 acceleration instantly.
 
physicsnobrain said:
The object instantly goes from having acceleration then goes to 0 acceleration instantly.
A sudden change in acceleration would not cause discomfort. If you were to step out off a ledge your vertical acceleration would change very quickly from 0 to g, but you would feel no shock. There are two points in the trajectory where something does change suddenly from nonzero to zero, and that would cause a shock. What is that something? If the change were really to take no time at all, what would the acceleration be?
 
haruspex said:
A sudden change in acceleration would not cause discomfort. If you were to step out off a ledge your vertical acceleration would change very quickly from 0 to g, but you would feel no shock. There are two points in the trajectory where something does change suddenly from nonzero to zero, and that would cause a shock. What is that something? If the change were really to take no time at all, what would the acceleration be?

Is it when the object moves up, then proceeds to stop moving up instantly?
 
NascentOxygen said:
I'd give you 4 out of 5 for that. :smile:

During the object's travel, there is a moment which could be described as <CRUNCH!>. Where is this point, and how would it show up on the acceleration vs time plot?

I'd leave out that right hand side vertical line. It's doubtful.

ok i will try this.
 
Last edited:
So you're saying the acceleration time graph should look like this?
Hand-drawn acceleration versus time graph with a horizontal t axis and a vertical axis marked 0, showing a short step below zero at the start and a horizontal segment further along.
 
physicsnobrain said:
The object instantly goes from having acceleration then goes to 0 acceleration instantly.
Except you told me that we don't know what happens there, where I circled at the right. The recording stops as soon as the object passes through zero displacement. We don't know whether it smoothly continues on to a negative displacement or whether it halts at zero (you drew it showing that it stops at zero, but then clarified that you did that in error). So the end of the graph is an unknown; we definitely cannot say there is a bruising crunch there.

What is happening where I drew the red arrow?

EDIT: Ah, I see you answered already:
Is it when the object moves up, then proceeds to stop moving up instantly?
Yes, there is a sudden change of speed there. So how to improve your acceleration vs time graph to show this happening?
 
Last edited:
NascentOxygen said:
EDIT: Ah, I see you answered already:

Yes, there is a sudden change of speed there. So how to improve your acceleration vs time graph to show this happening?

I'm just not seeing it. When I separate this graph into three distinct segments ( reflective of the three in the displacement time graph) this graph seems to make perfect sense to me:
Acceleration time graph with axis labelled 0 on the vertical axis and t on the horizontal axis, showing three segments labelled A, B and C: A and C dip below zero and B lies on zero.


Also, would a good scenario be similar to the one you said previously, but instead of a t-shirt, a wet toilet paper ball is thrown to the ceiling, sticks to the ceiling for a few seconds, then falls back down?
 
physicsnobrain said:
I'm just not seeing it. When I separate this graph into three distinct segments ( reflective of the three in the displacement time graph) this graph seems to make perfect sense to me:
Hand-drawn acceleration-time graph with t on the horizontal axis and 0 marked on the vertical axis; three rectangular pulses labelled A, B and C, with A and C dipping below zero and B on the zero line.

Okay. Stop right there. Here's an exam question: an object with some initial upward velocity is subjected to the acceleration you show in your graph. Sketch the expected velocity vs time graph.

Also, would a good scenario be similar to the one you said previously, but instead of a t-shirt, a wet toilet paper ball is thrown to the ceiling, sticks to the ceiling for a few seconds, then falls back down?
Yes. I tried various scenarios, including a sticky tennis ball, wet washing, and a spit ball (bogan kids at school would chew up paper and flick a ball of it onto the classroom ceiling!) That dwell time is important.

Now, your graph for the above?
 
Attachments
  • Hand-drawn acceleration-time graph with t on the horizontal axis and 0 marked on the vertical axis. Three rectangular pulses are labelled A, B and C, with A and C below the zero line and B along it.
    2exrn2b.png
    1 KB · Views: 458
NascentOxygen said:
Okay. Stop right there. Here's an exam question: an object with some initial upward velocity is subjected to the acceleration you show in your graph. Sketch the expected velocity vs time graph.

Now, your graph for the above?

The acceleration time graph I made just seems to work for this, I honestly can't figure out the change:
Hand-drawn velocity time graph with axes v vertical and t horizontal, zero line marked 0. Region A above zero near the origin, region B flat on the axis, and region C below zero to the right.
 
During period A, under the influence of a constant acceleration, the velocity is seen to be steadily decreasing. When acceleration disappears by fading to zero, the velocity will remain as it was at that moment. There is nothing to cause it to suddenly drop to zero speed.

So, can you now sketch expected velocity vs time for the acceleration vs time graph you drew?
 
Last edited:
physicsnobrain said:
The acceleration time graph I made just seems to work for this, I honestly can't figure out the change:
Hand-drawn velocity versus time graph with a vertical v axis, a horizontal t axis and a zero line; three labelled areas A, B and C, with A above zero, B on the zero line and C below zero.
If the velocity changes from a nonzero value to zero in an extremely short time, how great is the acceleration?
 
haruspex said:
If the velocity changes from a nonzero value to zero in an extremely short time, how great is the acceleration?

not very great. Perhaps if I draw it less on my graph?
 
haruspex said:
If the velocity changes from a nonzero value to zero in an extremely short time, how great is the acceleration?


You're saying it should look like this:
Hand-drawn acceleration versus time graph titled Acceleration time graph, with a horizontal t axis and the 0 level marked on the vertical axis; a short segment sits just below zero near the start and a rectangular dip below zero appears later.