Analyzing the Effects of Battery Position on ##C_m-\alpha## Graph

In summary, the addition of a counterweight to a model plane project, which can be considered as the battery, will affect the ##C_m-\alpha## graph in the longitudinal direction. Placing the battery at the back of the current center of mass will decrease the slope of the graph, as the new center of mass will be further back and reduce ##l_t## while increasing ##hc##. The equation (7.24) from Anderson's Intro to Flight shows that this will also decrease the value of ##V_H## at $L_{wing}=0$, resulting in a smaller ##C_{m\,(L=0)}##. However, it is unclear which change, the increase in ##h## or decrease in ##
  • #1
Leo Liu
353
156
I am trying to determine how the addition of a counterweight affects the ##C_m-\alpha## (in longitudinal direction) graph for a model plane project, where the counterweight can be considered as the battery.

Screenshot 2022-11-28 at 11.18.08 PM.png

Screenshot 2022-11-28 at 11.27.45 PM.png

Suppose we try to place the battery at the back of the current CoM. The new CoM will be at further back, reducing ##l_t## and increasing ##hc##. According to Anderson't Intro to Flight, the equation is as follows:
this will decrease the slope of the ##C_m-\alpha## curve:

Screenshot 2022-11-28 at 11.22.45 PM.png

Now I am wondering if it will have a significant impact on the slope; ##h## is larger, while ##V_H## is smaller. Yet I am not sure which change is more significant to the moment slope.

From the equation (7.24) we can see that at $L_{wing}=0$, ##V_H## will become smaller due to a smaller ##l_t##, increasing the value of ##C_{m\,(L=0)}##:
Screenshot 2022-11-28 at 11.18.48 PM.png

where
Screenshot 2022-11-28 at 11.31.49 PM.png
.

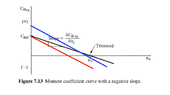
I think the graph of the line will look like either one of the added lines. The blue one will result in a lower equilibrium angle, thus providing a lower ##C_L##; yet the red line will allow a higher flight angle, thus producing more lift.
Screenshot 2022-11-28 at 11.39.36 PM.png

Could someone please give a bit more insight into this and tell me if my reasoning is correct?
 

Attachments

  • Screenshot 2022-11-28 at 11.23.27 PM.png
    Screenshot 2022-11-28 at 11.23.27 PM.png
    12 KB · Views: 89
Last edited:
Physics news on Phys.org

1. How does battery position affect the ##C_m-\alpha## graph?

The battery position can affect the ##C_m-\alpha## graph in several ways. It can impact the voltage and current readings, which in turn affect the slope and shape of the graph. Additionally, the position of the battery can also affect the internal resistance of the battery, which can impact the overall performance of the battery and the resulting graph.

2. What is the significance of analyzing the effects of battery position on the ##C_m-\alpha## graph?

Analyzing the effects of battery position on the ##C_m-\alpha## graph can provide valuable insights into the performance and efficiency of the battery. It can help identify any potential issues or limitations in the battery's design and inform improvements for future battery designs. Additionally, understanding the relationship between battery position and the ##C_m-\alpha## graph can aid in optimizing the battery's performance for specific applications.

3. How can the battery position be changed in an experiment to analyze its effects on the ##C_m-\alpha## graph?

The battery position can be changed by physically moving the battery to different locations within the circuit. This can be done by using different battery holders or by manually adjusting the battery's position within the holder. Additionally, the orientation of the battery (e.g. upright, horizontal) can also be changed to observe its effects on the ##C_m-\alpha## graph.

4. What are some potential variables that could affect the results of analyzing battery position on the ##C_m-\alpha## graph?

Some potential variables that could affect the results of this analysis include the type and model of the battery, the internal resistance of the battery, the circuit components used, and the environmental conditions (e.g. temperature, humidity). It is important to control for these variables as much as possible to ensure accurate and reliable results.

5. How can the data from analyzing battery position on the ##C_m-\alpha## graph be interpreted?

The data from this analysis can be interpreted by looking at the slope and shape of the ##C_m-\alpha## graph. A steeper slope indicates a higher capacity and a flatter slope indicates a lower capacity. The shape of the graph can also provide insights into the battery's performance and any potential limitations. Additionally, comparing the data from different battery positions can help identify the optimal position for maximum battery performance.

Similar threads

  • Classical Physics
Replies
9
Views
464
Replies
1
Views
731
  • Advanced Physics Homework Help
Replies
7
Views
4K
  • Introductory Physics Homework Help
Replies
6
Views
5K
  • Quantum Physics
Replies
1
Views
1K
  • Introductory Physics Homework Help
Replies
1
Views
22K
  • Special and General Relativity
2
Replies
40
Views
2K
  • Engineering and Comp Sci Homework Help
Replies
7
Views
15K
  • Sci-Fi Writing and World Building
Replies
21
Views
1K
Replies
4
Views
2K
Back
Top