- #1
rudransh verma
Gold Member
- 1,067
- 95
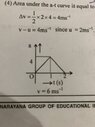
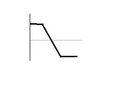
- Homework Statement
- The acceleration time graph of a particle moving in straight line is given below. The velocity of particle at t=0 is 2 m/s. The velocity after 2s will be?
- Relevant Equations
- Area under the curve will give velocity.
##v=\frac12 *1*4+\frac12*1*4= 4 m/s## but the answer is wrong.