Help Plotting Phase Difference using LTSpice please
- Thread starter IronaSona
- Start date
Click For Summary
SUMMARY
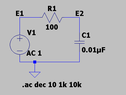
This discussion focuses on plotting phase difference in LTSpice, specifically for circuit analysis. Users share techniques for visualizing phase relationships between signals using LTSpice's built-in tools. Key methods include utilizing the 'FFT' function and adjusting the waveform viewer settings to display phase data accurately. Participants emphasize the importance of understanding circuit behavior to effectively interpret phase differences.
PREREQUISITES- Familiarity with LTSpice version 17.0 or later
- Understanding of circuit analysis principles
- Knowledge of Fast Fourier Transform (FFT) concepts
- Basic skills in waveform interpretation
- Explore LTSpice documentation on FFT analysis
- Learn how to configure waveform viewer settings in LTSpice
- Research phase difference concepts in signal processing
- Practice plotting phase relationships in sample circuits using LTSpice
Electrical engineers, circuit designers, and students studying signal processing who need to analyze phase relationships in electronic circuits using LTSpice.
Similar threads
Engineering
AM-AM and AM-PM graph generation in LTSpice
- · Replies 11 ·
- · Replies 12 ·
- · Replies 12 ·
- · Replies 9 ·
- · Replies 21 ·
- · Replies 6 ·
- · Replies 17 ·