Intensity Distribution of Superposition of 2 Waves

AI Thread Summary
The discussion centers on the intensity distribution of two coherent waves, where one wave has an amplitude three times greater than the other. The resultant intensity is calculated using the formula I = I(1) + I(2) + 2√(I(1)*I(2))cosΦ, leading to maximum and minimum intensity values of 16I(o) and 4I(o), respectively. Participants debate the assumption of the sources being colocated and the implications for intensity distribution, emphasizing that a nontrivial intensity plot requires a spatial separation of the sources. Clarifications are made regarding the nature of coherent sources, with some asserting that a fixed phase relationship does not necessitate a phase difference of zero. Ultimately, the conversation highlights the importance of accurately interpreting intensity distribution in wave interference scenarios.
warhammer
Messages
164
Reaction score
33
Homework Statement
Amplitudes of light coming from coherent sources (say 1 and 3 with their units) are different. One has an amplitude 3 times more than the other. Plot the intensity distribution of the resulting wave.
Relevant Equations
Intensity ~ (Amplitude)^2
Intensity I=I(1)+I(2) +2√(I(1)*I(2))*cosΦ where Φ=Phase Difference
We assume incident waves to be:

y(1)=y(o)sin(wt)
y(2)=3y(o)sin(wt+Φ)

As Intensity~(Amplitude)^2

We get y(2)=3y(1)
This gives us I(2)=9I(1)

We assume I(1)=I(o) & I(2)=9I(o)

Resultant Wave Intensity I=I(1)+I(2) +2√(I(1)*I(2))*cosΦ ---->

I(o) + 9I(o) + 6I(o)cosΦ (We can take cos of this angle=1 for coherent sources)

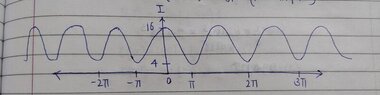
This gives us I=16I(o)
Thus I(max) = {y(1)+3y(1)}^2= 16y(1)^2
I(min)={3y(1)-y(1)}^2= 4y(1)^2

(A Rough representation of the Plot Distribution is attached below).

I request someone to please guide if my approach and solution are correct/incorrect 🙏🏻
 

Attachments

  • 20220114_215850.jpg
    20220114_215850.jpg
    21.3 KB · Views: 116
Last edited:
Physics news on Phys.org
Where are these sources in relation to each other? Are we plotting over an area or, say, a straight line through the two sources?
 
haruspex said:
Where are these sources in relation to each other? Are we plotting over an area or, say, a straight line through the two sources?
As the question mentions coherence and we assume Φ=0, so they are essentially moving along; the only distinction one can pick is between their amplitudes.
 
warhammer said:
As the question mentions coherence and we assume Φ=0, so they are essentially moving along; the only distinction one can pick is between their amplitudes.
It asks for an intensity distribution. You seem to have supposed the sources are colocated, so the amplitudes add trivially and produce the same intensity everywhere. What you have drawn is a snapshot of the combined wave, not an intensity plot.
For the intensity distribution to be nontrivial you need there to be some other difference between the sources, such as being separated.
 
haruspex said:
It asks for an intensity distribution. You seem to have supposed the sources are colocated, so the amplitudes add trivially and produce the same intensity everywhere. What you have drawn is a snapshot of the combined wave, not an intensity plot.
For the intensity distribution to be nontrivial you need there to be some other difference between the sources, such as being separated.
But isn't it safe to assume that too as coherency has been mentioned in the question?
Also, the Intensity Distribution of the resultant wave has been asked, so one would obviously combine both the waves
 
warhammer said:
But isn't it safe to assume that too as coherency has been mentioned in the question?
It says "the sources are coherent", which probably only means that each source consists of a coherent beam. I would not assume the sources are also in phase with each other. As I wrote, if they are colocated and in phase with each other the whole thing is trivial. The intensity plot would be a horizontal line at +16.
warhammer said:
the Intensity Distribution of the resultant wave has been asked, so one would obviously combine both the waves
Of course you add the waves, but you do not seem to understand what an intensity distribution means: it is a graph of I either against position (in space, across a plane, or along a line) or against angle of emission from a source (##-\pi## to ##+\pi##). Or perhaps against wavelength, for a mixed wavelength source.
Your horizontal axis seems to be marked in radians, off to infinity, as though it is phase.

Let's go back to basics:
A wave from a coherent light source can be written as ##y=A\sin(\lambda x-\omega t+\phi)##. Its intensity at x is defined as the average value of ##y^2## over time. For this simple case it suffices to average over one period: ##I(x)=\int_{t=0}^{2\pi/\omega}y^2.dt\frac{\omega}{2\pi}##, which gives ##I=A^2## for all x. It does not give a sine wave as you have drawn, and it does not depend on phase.

is there a diagram with the question? Have you quoted it word for word? Is post #1 maybe a translation?
 
Last edited:
  • Informative
Likes warhammer
haruspex said:
It says "the sources are coherent", which probably only means that each source consists of a coherent beam. I would not assume the sources are also in phase with each other. As I wrote, if they are colocated and in phase with each other the whole thing is trivial. The intensity plot would be a horizontal line at +16.

Of course you add the waves, but you do not seem to understand what an intensity distribution means: it is a graph of I either against position (in space, across a plane, or along a line) or against angle of emission from a source (##-\pi## to ##+\pi##). Or perhaps against wavelength, for a mixed wavelength source.
Your horizontal axis seems to be marked in radians, off to infinity, as though it is phase.

Let's go back to basics:
A wave from a coherent light source can be written as ##y=A\sin(\lambda x-\omega t+\phi)##. Its intensity at x is defined as the average value of ##y^2## over time. For this simple case it suffices to average over one period: ##I(x)=\int_{t=0}^{2\pi/\omega}y^2.dt\frac{\omega}{2\pi}##, which gives ##I=A^2## for all x. It does not give a sine wave as you have drawn, and it does not depend on phase.

is there a diagram with the question? Have you quoted it word for word? Is post #1 maybe a translation?
I apologise for an extremely delayed response. I do understand how Intensity Distributions are plotted across. I was able to get in touch with my Professor who assigned this question and he has marked my solution wholly correct and even confirmed that the sources are indeed colocated.

The main book that we use (Optics by Ajoy Ghatak) mentions that Intensity for a generic wave is proportional to 4 times the square of the cosine of the phase. If you would like, I can share that derivation here.
 
warhammer said:
Homework Statement:: Amplitudes of light coming from coherent sources (say 1 and 3 with their units) are different. One has an amplitude 3 times more than the other. Plot the intensity distribution of the resulting wave.
Relevant Equations:: Intensity ~ (Amplitude)^2
Intensity I=I(1)+I(2) +2√(I(1)*I(2))*cosΦ where Φ=Phase Difference

I(o) + 9I(o) + 6I(o)cosΦ (We can take cos of this angle=1 for coherent sources)
This is simply not true. Coherent sources have a fixed phase relationship but it is not required to be zero. So I have no idea what the question is or what the answer means.
 
warhammer said:
Intensity for a generic wave is proportional to 4 times the square of the cosine of the phase
Nonsense. Seems to be a confusion (or a misquote) of the formula for the resulting intensity of interfering waves. If two waves of amplitude A interfere at a location with phase difference ##\phi## then the resulting intensity at that location is ##4A^2\cos^2(\phi)##. See e.g. https://en.wikipedia.org/wiki/Wave_interference#Derivation

If the sources in this question are identical and colocated then there will be no phase difference anywhere. The intensity is therefore ##(3+1)^2A^2## everywhere. As a graph against location that is a horizontal line, not a sine wave.
And it doesn't mean anything to graph it against time since, by definition, intensity is an average over time.

Edit: the only way I can see to make your solution correct is to add to the problem statement:
"the phase difference between the sources is varied. Plot the resulting intensity against the phase difference applied"
 
Last edited:
  • Like
Likes BvU and hutchphd
  • #10
hutchphd said:
This is simply not true. Coherent sources have a fixed phase relationship but it is not required to be zero. So I have no idea what the question is or what the answer means.
I will offer a correction/verified solution against my assumption in #1.

Expression for Intensity is: I= I(1) + I(2) + 2√(I(1)*i(2)) cosΦ

I(max)= (√I(1) + √I(2))^2 (Φ=1~I(max) & -1~I(min)
I(min)= (√I(1) - √I(2))^2

Given: E1 (say)=E
E2=3E
then I(max)=16 I(o)
& I(min) = 4 I(o)

The graph is the same as attached in #1. The Y Axis denotes Intensity I which is proportional to I(o) cos^2 (Φ/2). The X Axis runs from -Φ/2 to +
Φ/2
 
  • #11
To find the intensity of two waves one adds the amplitudes, squares the result and does a time average. I frankly do not know what you are doing, but it is not correct. If the prof marked your solution correct you should listen to him/her I suppose!
LateX would be a good idea.
 
  • #12
warhammer said:
The Y Axis denotes Intensity I which is proportional to I(o) cos^2 (Φ/2). The X Axis runs from -Φ/2 to +
Φ/2
But where is this phase difference coming from? According to your posts #3 and #5 there is none.
 
Back
Top