Modelling of two phase flow in packed bed using conservation equations

Join the discussion
Registration is free. Ask a follow-up in this thread, or start your own.
454 replies · 44K views · last reply
Chestermiller said:
Note finally, that, with no loss of generality, we can simplify further by taking the reference temperature for zero enthalpy of the liquid as Tsat, such that hsat,L=0 and hsat,V=Δhvaporization.
Got it, so just adding that in:

1. If ##h\leq h_{sat,L}##, then
$$T=T_{sat}+h/C_{PL}$$
$$m=\rho_L V$$

2. If ##h_{sat,L}\leq h \leq h_{sat,V}## then
$$T=T_{sat}$$
$$m=\frac{V}{\left[\frac{1}{\rho_L}+\left(\frac{RT_{sat}}{PM}-\frac{1}{\rho_L}\right)\left(\frac{h}{\Delta h_{vap}}\right)\right]}$$

3. If ##h_{sat,V}\leq h## then
$$T=T_{sat}+(h-\Delta h_{vap})/C_{PV}$$
$$m=\frac{PM}{RT} V$$

Chestermiller said:
We expect that the results of this calculation will match the results from the temperature-version, so it should provide a good validation of the model.
The post #38 model yes?

Chestermiller said:
This method gets us out of the artificial approach of using T1 and T2, and is "exact" for the relations between enthalpy, temperature. and mass.
It does, I guess dealing with a mixture means that we should get an average value for ##T_{sat}## here (N2 boils at 77K, O2 boils at 90K) so maybe a Tsat of 73.5K is suitable here? The same for any other constant I could take the average of the N2 and O2 values.

I think I follow this model fully so, I will aim to implement this tomorrow morning!
 
Engineering news on Phys.org
casualguitar said:
Got it, so just adding that in:
More like
casualguitar said:
1. If ##h\leq 0##, then
$$T=T_{sat}+h/C_{PL}$$
$$m=\rho_L V$$

2. If ##0\leq h \leq \Delta h_{vap}## then
$$T=T_{sat}$$
$$m=\frac{V}{\left[\frac{1}{\rho_L}+\left(\frac{RT_{sat}}{PM}-\frac{1}{\rho_L}\right)\left(\frac{h}{\Delta h_{vap}}\right)\right]}$$

3. If ##\Delta h_{vap}\leq h## then
$$T=T_{sat}+(h-\Delta h_{vap})/C_{PV}$$
$$m=\frac{PM}{RT} V$$

casualguitar said:
The post #38 model yes?
Yes.
casualguitar said:
It does, I guess dealing with a mixture means that we should get an average value for ##T_{sat}## here (N2 boils at 77K, O2 boils at 90K) so maybe a Tsat of 73.5K is suitable here? The same for any other constant I could take the average of the N2 and O2 values.
Please use your best judgment for this. I guess at some point the model can be modified to more the precise VLE behavior. I think the 73.5 is a typo, and you meant 83.5, right?
 
Working on the above model now I should have results for this in an hour or so. I'll change the inputs of the model we're comparing to so that they're close to equivalent. What would a U = 0 model show us? The effect of having zero heat transfer between fluid and solid?
 
casualguitar said:
Working on the above model now I should have results for this in an hour or so. I'll change the inputs of the model we're comparing to so that they're close to equivalent. What would a U = 0 model show us? The effect of having zero heat transfer between fluid and solid?
It would tell us the effect of purging liquid initially at a low temperature from the lumped mixed tank with a vapor at a high temperature.
 
  • Like
Likes   Reactions: casualguitar
Chestermiller said:
It would tell us the effect of purging liquid initially at a low temperature from the lumped mixed tank with a vapor at a high temperature.
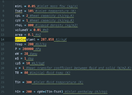
So I made the above model, and ran it for ranges of input parameters etc. I've printed the output and I can see the expected increase of temperature to the saturation temperature, a (short) constant temperature zone, and then an increase up to the fluid inlet temperature. I've checked that the correct enthalpy/mass equations are being used for the right enthalpy ranges. I've also made this models inputs as close as possible to the old model inputs. This one produces results that are quite a bit different, in that the temperature of the fluid and gas increase at a much slower rate. I'm attaching the output to model 1 and 2, and also the code to the new model below. Note I plotted over 10000s as this was the time required to see a levelling out of the temperature curve in the new model. I'm assuming for now there is a bug in my code somewhere so I'll hopefully find it this evening!

New model:

Line plot titled Figure 1 of T_solid (green) and T_Fluid (blue) against t from 0 to 10000. Both curves rise from about 80 to about 300, with T_Fluid slightly ahead, then level off near 300.


Old model:
Line plot of T and Ts against t from 0 to 10000. Both curves rise steeply from about 80 to about 300, levelling off near 300 by around t = 2000. Blue T rises slightly faster than green Ts.


Enthalpy model code:
Screenshot of Python code in a dark editor: imports numpy, scipy, solve_ivp, matplotlib and math, then constants minL = 0.05, Tsat = 105, cpL = 2, cpV = 1, rhoL = 800, volumeV = 0.01, area = 0.1, gasConstant = 287.058, hVap = 200, P = 200000, mW = 28, mS = 1, cpS = 10, u = 1, T0 = 80, Tin = 300, and hIn = 200 + cpV*(Tin-Tsat).

Python code screenshot defining function temp(H) returning temperature from enthalpy with branches for liquid, two-phase and vapour, and function mass(H,T) returning holdup mass with matching branches.

Screenshot of Python code defining a my_system function for two-phase packed bed heat transfer, solved with solve_ivp using the LSODA method, followed by a plot of solid and fluid temperature against time.
 
I don’t see anything like a constant temperature zone in either plot. What were the parameter values you used, including the mass flow rate in, and the solid mass and heat capacity?
 
Chestermiller said:
I don’t see anything like a constant temperature zone in either plot. What were the parameter values you used, including the mass flow rate in, and the solid mass and heat capacity?
There is a constant temperature zone in the new plot, however it’s very small (I think it spans only a few seconds). I’m away from my laptop currently so I will zoom in on this in the plot later this evening. In regards to mass flow in, solid mass and heat capacity, these are minL, mS and cpS in the first code image. I’ll also change these parameters this evening to get a longer constant temperature zone
 
casualguitar said:
There is a constant temperature zone in the new plot, however it’s very small (I think it spans only a few seconds). I’m away from my laptop currently so I will zoom in on this in the plot later this evening. In regards to mass flow in, solid mass and heat capacity, these are minL, mS and cpS in the first code image. I’ll also change these parameters this evening to get a longer constant temperature zone
You omitted multiplying by the bed volume when you calculated the mass of fluid in the bed for pure vapor. This is an indication that you really need to spend some time testing and checking your code.

What are the units of the physical parameters in your code?

Heat transfer coefficeint
Heat transfer area
Heat capacity of bed
mass of bed
 
Chestermiller said:
You omitted multiplying by the bed volume when you calculated the mass of fluid in the bed for pure vapor.
Thanks!
Chestermiller said:
This is an indication that you really need to spend some time testing and checking your code.
Yes I agree completely. I did spend over an hour looking, however this is really a bug I should have been able to find if I'd spent some more time. I'll take more care to find these myself from now on
Chestermiller said:
What are the units of the physical parameters in your code?
Units included in the comments here:
Screenshot of a code editor showing Python-style variable assignments with unit comments: minL = 0.05, Tsat = 105, cpL = 2, cpV = 1, rhoL = 800, volumeV = 0.01, area = 0.1, gasConstant = 287.058, hVap = 200, P = 200000, mW = 28, mS = 1, cpS = 10, u = 1, T0 = 80, Tin = 300, and hIn = 200 + cpV*(Tin-Tsat).

Updated graph below. Shows the constant temperature zone and levels out at the same rate:
Line graph of T_solid (green) and T_Fluid (blue) against t from 0 to 1000; both rise, the fluid curve staying above the solid, with a plateau near 105 at early times.

I'm going to make a graph of this one over the previous model graph to see how well they actually overlay. However from visual inspection of the individual graphs they look ok
 
Attachments
  • Screenshot of a code editor showing Python-style variable assignments with unit comments, including minL = 0.05 (inlet mass flow, kg/s), Tsat = 105 (K), cpL = 2, cpV = 1, rhoL = 800, gasConstant = 287.058 (J/kgK), P = 200000 (Pa), and hIn = 200 + cpV*(Tin-Tsat).
    Screenshot 2021-11-16 at 22.03.19.png
    37.6 KB · Views: 175
It seems to me what is happening in this calculation is that the heat transfer resistance between the gas an the bed is very low (equivalent to very high heat transfer coefficient) so that the gas always comes very close to the bed temperature. Moreover, once the temperature rises above ##T_{sat}##, there is all gas in the tank, and the thermal inertia of this gas is very low compared to the thermal inertia of the bed. So it can be neglected. So the rate at which the incoming gas gives up heat to the bed is ##\dot{m}C_{PV}(T_{in}-T_S)## and the heat balance on the bed in this range of temperatures simplifies to $$m_SC_{PS}\frac{dT_S}{dt}=\dot{m}C_{PV}(T_{in}-T_S)$$
This same result can be obtained by (a) eliminating the heat transfer term between the gas heat balance and solid heat balance, then (b) setting the instantaneous gas temperature in the bed equal to the bed temperature and then (c) neglecting the thermal inertia of the gas.

The characteristic time constant for the system in this range of temperatures is then $$\tau=\frac{m_SC_{PS}}{\dot{m}C_{PV}}$$What is the value that you calculate for this time constant for your model inputs?
 
Chestermiller said:
What is the value that you calculate for this time constant for your model inputs?
Line graph titled Figure 1 plotting temperature against t from 0 to 1000, with y-axis 80 to 300. Four curves: fluid temperature (dH/dt model) and (dT/dt model) in blue, fluid and solid temperature (dT/dt model) in green; all rise and approach about 290 by t = 1000.

Just adding the comparison graph here as mentioned before
Chestermiller said:
Moreover, once the temperature rises above Tsat, there is all gas in the tank, and the thermal inertia of this gas is very low compared to the thermal inertia of the bed. So it can be neglected.
Understood

Chestermiller said:
This same result can be obtained by (a) eliminating the heat transfer term between the gas heat balance and solid heat balance, then (b) setting the instantaneous gas temperature in the bed equal to the bed temperature and then (c) neglecting the thermal inertia of the gas.
Understood also.

Chestermiller said:
The characteristic time constant for the system in this range of temperatures is then τ=mSCPSm˙CPVWhat is the value that you calculate for this time constant for your model inputs?

##M_S## = 1, ##C_{PS}## = 10, ##mass flow (kg/s) = 0.05##, ##C_{PV}## = 1, which returns the time constant:
$$\tau=200$$

I haven't looked into what a time constant of 200s means yet (quite late here). My initial sense is that it is very large. I will do this first thing tomorrow

I've also spotted an error in my previous model. The heat capacity of the solid is higher than any reasonable value for materials of its type (typical values are between 0.8 and 2). I'll rerun with a reasonable value tomorrow morning.

Looking at the time constant equation, a solid heat capacity of 1, for example, reduces the time constant to 20s which seems a lot more reasonable.

As I say I'll make these changes in the morning
 
casualguitar said:
View attachment 292463
Just adding the comparison graph here as mentioned before

UnderstoodUnderstood also.
##M_S## = 1, ##C_{PS}## = 10, ##mass flow (kg/s) = 0.05##, ##C_{PV}## = 1, which returns the time constant:
$$\tau=200$$

I haven't looked into what a time constant of 200s means yet (quite late here). My initial sense is that it is very large. I will do this first thing tomorrow

I've also spotted an error in my previous model. The heat capacity of the solid is higher than any reasonable value for materials of its type (typical values are between 0.8 and 2). I'll rerun with a reasonable value tomorrow morning.

Looking at the time constant equation, a solid heat capacity of 1, for example, reduces the time constant to 20s which seems a lot more reasonable.

As I say I'll make these changes in the morning
Nice. Please make a semi-log plot of ##T_{in}-T## as a function of t, and let's see what you get.

I should also mention that the R in the equations I wrote is the universal gas constant, not the customized value for air. This has caused the masses of vapor you have used in the calculations to be a factor of 28 too high.
 
Last edited:
  • Like
Likes   Reactions: casualguitar
Chestermiller said:
Nice. Please make a semi-log plot of ##T_{in}-T## as a function of t, and let's see what you get.

I should also mention that the R in the equations I wrote is the universal gas constant, not the customized value for air. This has caused the masses of vapor you have used in the calculations to be a factor of 28 too high.
Updating the overlay plot here with a solid heat capacity of ##1.1 kJ/kg.K##. As expected the temperature levels off at a faster rate
Line plot of temperature against t from 0 to 400, with four curves labelled fluid temperature (dH/dt model), fluid temperature (dT/dt model), fluid temperature (dH/dt model) and solid temperature (dT/dt model); the curves rise from about 80 to about 300, with a plateau near 105 for the fluid curves.


Chestermiller said:
I should also mention that the R in the equations I wrote is the universal gas constant, not the customized value for air.
Got it. So I should divide my value by the molecular weight, meaning that the new units for ##R## are ##J/mol.K##?

Making the semi-log plot now
 
Chestermiller said:
Nice. Please make a semi-log plot of ##T_{in}-T## as a function of t, and let's see what you get.
##T_{in} - T## plot for the enthalpy model:
Line graph of Tin minus T_solid (green) and Tin minus T_Fluid (blue) against t from 0 to 1000; both curves start near 220 and decline, the blue curve dropping faster early and staying lower.

To be clear, what I did here was took the final temperature arrays for the fluid and solid, and then created two new arrays ##(T_{in}-T_{fluid})## and ##(T_{in}-T_{solid})## and plotted these versus ##t##
 
Last edited:
casualguitar said:
Updating the overlay plot here with a solid heat capacity of ##1.1 kJ/kg.K##. As expected the temperature levels off at a faster rate
View attachment 292479Got it. So I should divide my value by the molecular weight, meaning that the new units for ##R## are ##J/mol.K##?

Making the semi-log plot now
No. You multiply your value by 28 kg/(k-mole) to get ##R=8314\ J/(k-mole\ K)##
 
casualguitar said:
##T_{in} - T## plot for the enthalpy model:
View attachment 292480
To be clear, what I did here was took the final temperature arrays for the fluid and solid, and then created two new arrays ##(T_{in}-T_{fluid})## and ##(T_{in}-T_{solid})## and plotted these versus ##t##
Good. Now have your plotting software change the ordinate scale to logarithmic.
 
Chestermiller said:
No. You multiply your value by 28 kg/(k-mole) to get ##R=8314\ J/(k-mole\ K)##
Ok, new plot below with the updated R value. The effect of the updated R value is that the time taken to reach steady state is approximately cut in half:
Line plot of temperature against t from 0 to 200, with fluid and solid curves from two dH/dt and dT/dt models rising from about 80 to about 300 with a sharp jump near t=20-25.

Chestermiller said:
Good. Now have your plotting software change the ordinate scale to logarithmic.
Both time and temperature axes to log scale?
 
Chestermiller said:
Good. Now have your plotting software change the ordinate scale to logarithmic.
Here is the plot when both x and y are plotted in log scale:
Log-log line plot titled Figure 1 of Tin minus T against time, with two decreasing curves labelled Tin - T_solid (green) and Tin - T_Fluid (blue); the blue fluid curve falls below the green solid curve at later times.

What is the value of this plot? It shows us that at the later times (in the gas phase) the temperatures rises more rapidly towards the inlet gas temperature, meaning that (as you said) the thermal inertia of the gas is very low compared to the thermal inertia of the bed?
 
casualguitar said:
Ok, new plot below with the updated R value. The effect of the updated R value is that the time taken to reach steady state is approximately cut in half:
View attachment 292481

Both time and temperature axes to log scale?
no. Just temperature.
 
  • Like
Likes   Reactions: casualguitar
casualguitar said:
Here is the plot when both x and y are plotted in log scale:
View attachment 292482
What is the value of this plot? It shows us that at the later times (in the gas phase) the temperatures rises more rapidly towards the inlet gas temperature, meaning that (as you said) the thermal inertia of the gas is very low compared to the thermal inertia of the bed?
just log scale on temperature, not time.
 
Chestermiller said:
no. Just temperature.
Here is the plot when only temperature is plotted in log scale:
Log-scale line plot of Tin minus T against time from 0 to about 3100, with two curves: Tin minus T_solid (green) and Tin minus T_Fluid (blue), both falling roughly linearly on the log axis and dropping sharply near t = 3000.


Actually, I extended the range out to 10k seconds and this happens:
Log-scale line plot of Tin minus T against time, with two curves, Tin minus T_solid in green and Tin minus T_Fluid in blue; both decay steeply to about 3000 s, then the curves restart near 5000 s, peak around 5600 s and fall to about 7700 s.

I'm going to see if any values have unexpected behaviour at about 5k seconds.

Actually, has this got something to do with stability, given that the derivatives will approach zero around this range?
 
casualguitar said:
Here is the plot when only temperature is plotted in log scale:
View attachment 292485

Actually, I extended the range out to 10k seconds and this happens:
View attachment 292486
I'm going to see if any values have unexpected behaviour at about 5k seconds.

Actually, has this got something to do with stability, given that the derivatives will approach zero around this range?
Don't you think that the issue here is one of precision (round-off error). Do you really feel that it is necessary to take the temperature to within 0.001 degrees of the inlet temperature? In my judgement, it is adequate to show the results out to about 1500 sec. If you want better precision than that, go to double precision.
 
Chestermiller said:
Don't you think that the issue here is one of precision (round-off error). Do you really feel that it is necessary to take the temperature to within 0.001 degrees of the inlet temperature? In my judgement, it is adequate to show the results out to about 1500 sec. If you want better precision than that, go to double precision.

Yes exactly that's what I mean also. No its not necessary to go to within 0.001K of the inlet temperature I just thought it was interesting to see.

Plot to 1500s:
Semi-log line plot of Tin minus T against time from 0 to 1500, with a log vertical axis from 1 to about 200. Green line for T_solid and blue line for T_Fluid both fall roughly linearly, with the blue fluid curve dropping sharply early on before following a parallel path below the green.


I'm going to collect each of these models into separate scripts now (to make a 'trail' of the model progression). Is there anything else important that I should do before we talk about introducing an axial temperature gradient?
 
casualguitar said:
Yes exactly that's what I mean also. No its not necessary to go to within 0.001K of the inlet temperature I just thought it was interesting to see.

Plot to 1500s:
View attachment 292488

I'm going to collect each of these models into separate scripts now (to make a 'trail' of the model progression). Is there anything else important that I should do before we talk about introducing an axial temperature gradient?
Is there a reason that the graph doesn't show a constant gas temperature during the phase change? Have you incorporated the change to the gas constant noted in post #76 yet?

Hold your horses. What is the slope of the straight line on the graph at times > 200 seconds, in terms of ##\Delta {lnT}/\Delta t##? The reciprocal of this is the time constant for the response in the vapor region. What do you get for the time constant? How does this compare with our expectations?
 
Chestermiller said:
Is there a reason that the graph doesn't show a constant gas temperature during the phase change? Have you incorporated the change to the gas constant noted in post #76 yet?
Yes it seems to be because I was plotting 100 points only, and the phase change zone is quite short so it mostly bypassed it in the context of a 1500s plot. A higher resolution plot below shows the constant temperature phase change zone. Its quite small:
Semi-log plot titled Figure 1 of Tin minus T against time from 0 to about 1500, with two near-straight decaying lines on a logarithmic y-axis: green Tin minus T_solid and blue Tin minus T_Fluid, the blue line bending sharply near t of about 26.

And zooming in on the phase change zone:
Line plot of temperature against time from 0 to about 48, with two curves on a log-scale y-axis from about 140 to 220: Tin - T_solid (green) declines gently, while Tin - T_Fluid (blue) falls steeply near 24 to 26 with a flat plateau near 195 before dropping further.

Chestermiller said:
Hold your horses. What is the slope of the straight line on the graph at times > 200 seconds, in terms of ΔlnT/Δt? The reciprocal of this is the time constant for the response in the vapor region. What do you get for the time constant? How does this compare with our expectations?
The slope for t>200:
$$\Delta {lnT}/\Delta t = -0.16$$

The time constant (taking the absolute value of the slope):
$$\tau = 6.09s$$

Hmm I'm not sure how this compares. So, it is smaller than the previously calculated value of 15s using this equation:
$$\tau=\frac{m_SC_{PS}}{\dot{m}C_{PV}}$$

Is this value in the realm of 'close enough for the purpose of this model'?

One thing that does concern me is that there is a sharp change in slope at around 26s in the vapour region. Why would this be? We would probably get a higher slope value in the vapour region if this was an error in the model, meaning that the estimated tau and actual tau would also be closer
 
casualguitar said:
Yes it seems to be because I was plotting 100 points only, and the phase change zone is quite short so it mostly bypassed it in the context of a 1500s plot. A higher resolution plot below shows the constant temperature phase change zone. Its quite small:
View attachment 292493
And zooming in on the phase change zone:
View attachment 292494
Thanks. Much better. How come, not that you've lowered the heat capacity of the bed, the bed temperature does not more closely approach the gas saturation temperature in this zone. It did in earlier plots before the bed heat capacity was lowered.
casualguitar said:
The slope for t>200:
$$\Delta {lnT}/\Delta t = -0.16$$

The time constant (taking the absolute value of the slope):
$$\tau = 6.09s$$
I get a temperature difference change by a factor of 10 every 700 seconds. I guess I made an error in specifying the slope I wanted. What I really wanted was ##\Delta \ln{(T_{in}-T)}/\Delta t##. This gives a time constant of about 300 seconds.
casualguitar said:
Hmm I'm not sure how this compares. So, it is smaller than the previously calculated value of 15s using this equation:
$$\tau=\frac{m_SC_{PS}}{\dot{m}C_{PV}}$$

Is this value in the realm of 'close enough for the purpose of this model'?
Now we are comparing 300 seconds with 15 seconds. This seems too large. Please provide the latest version of your enthalpy code.
casualguitar said:
One thing that does concern me is that there is a sharp change in slope at around 26s in the vapour region. Why would this be? We would probably get a higher slope value in the vapour region if this was an error in the model, meaning that the estimated tau and actual tau would also be closer
I am concerned about the sharp change too. Needs more study.
 
Chestermiller said:
How come, not that you've lowered the heat capacity of the bed, the bed temperature does not more closely approach the gas saturation temperature in this zone.
It seems that decreasing the value of R (back to my incorrect value which was 28 times smaller) has the effect of making the approach temperature value smaller. This is the plot with my incorrect R value:
Semi-log plot of Tin minus T against time from 0 to 1500, with a green curve for Tin minus T_solid and a blue curve for Tin minus T_Fluid, both falling roughly linearly on a log scale after an initial plateau near 200.

Chestermiller said:
I am concerned about the sharp change too. Needs more study.
I'll look into this now

Chestermiller said:
Please provide the latest version of your enthalpy code.
Screenshot of a Python code editor showing a script that imports numpy, scipy and matplotlib, defines constants such as minL, Tsat, cpL and rhoL, then defines functions temp(H) and mass(H,T) with conditional branches on enthalpy H.

Python code listing of a my_system function that defines heat balance derivatives for fluid and solid temperatures, with solve_ivp call, log-temperature plots and a time constant calculation.


I am looking for the reason for the sharp change now. I guess this will be different to the reason the time constant value is different
 
casualguitar said:
It seems that decreasing the value of R (back to my incorrect value which was 28 times smaller) has the effect of making the approach temperature value smaller.
Im not sure I know what you mean by the "approach temperature." The lower value of R makes the vapor density higher so that it has more thermal inertia. This would be roughly equivalent to the effect of increasing the heat capacity of the vapor.
casualguitar said:
This is the plot with my incorrect R value:
View attachment 292530

I'll look into this now

Run some diagnostic calculations where you print out things like h and m vs t to see if they are behaving the way you expect them to behave.
casualguitar said:
View attachment 292531
View attachment 292532

I am looking for the reason for the sharp change now. I guess this will be different to the reason the time constant value is different
The diagnostic calculations should provide some insight into this as well.

It looks like your latest code is using the high value for CS again. Is that what you intended?
 
Last edited:
Chestermiller said:
Im not sure I know what you mean by the "approach temperature." The lower value of R makes the vapor density higher so that it has more thermal inertia. This would be roughly equivalent to the effect of increasing the heat capacity of the vapor.
You asked previously why "the bed temperature does not more closely approach the gas saturation temperature in this zone", that is what I mean by the approach temperature i.e. the difference between the bed temperature and the gas saturation temperature
Chestermiller said:
Run some diagnostic calculations where you print out things like h and m vs t to see if they are behaving the way you expect them to behave.
Got it, working on this now