Plasma2
- 8
- 0
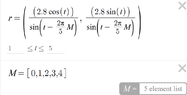
Hello. I have graphed a rose curve on Desmos using a parametric point, the equation looking like this:
View attachment 7923
However, I want the graph to be limited so that only values within the circle r=3.45 and r=9 are shown. I have tried using the curly brackets {3.45 <= r <= 9}, however this returns an error "You cannot multiply a point by a number". I have spent several hours searching for a fix to this, but to no avail. The built-in "t" restriction does not restrict the graph in this way, rather it deletes parts of it if the range is not at least 4. If anyone can help me restrict this function in such a way as to only show values within those circles, that would be very kind. Thank you!