DaveC426913
Gold Member
2025 Award
- 24,607
- 8,946
- TL;DR
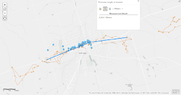
- A tornado swept through the town of Uxbridge Ontario last week. What does this data say?
Does anyone have a clue what the gold points and associated lines represent?
I notice that all the gold lines form closed loops (so they're not travel paths) and they cross themselves (so they're not contours).
I can't think of any type of data that would result in this.

I've tried to follow up but I can't decipher the Twitterverse.
I notice that all the gold lines form closed loops (so they're not travel paths) and they cross themselves (so they're not contours).
I can't think of any type of data that would result in this.
I've tried to follow up but I can't decipher the Twitterverse.