SUMMARY
Q1 and Q3 represent the first and third quartiles in a data set, respectively. Q1 indicates that 25% of the data points fall below this value, while Q3 signifies that 75% of the data points are below it. The median, known as Q2, is the middle value of the data set. Understanding these quartiles is essential for analyzing data distributions effectively.
PREREQUISITES
- Basic knowledge of statistical concepts, including quartiles
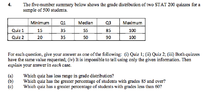
- Familiarity with data set analysis
- Understanding of median calculations
- Experience with data visualization tools
NEXT STEPS
- Research "Calculating quartiles in Excel" to apply these concepts practically
- Learn about "Interquartile Range (IQR)" for understanding data spread
- Explore "Box plots in data visualization" to represent quartiles graphically
- Study "Descriptive statistics in R" for advanced data analysis techniques
USEFUL FOR
Data analysts, statisticians, and anyone involved in data interpretation and visualization will benefit from this discussion on quartiles.