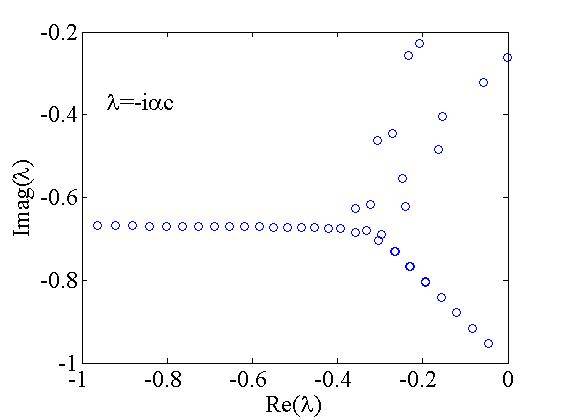
Can someone explain this plot of the Orr Sommerfeld equation?

  • Context: Graduate 
  • Thread starter Thread starter Navier-Stokes
  • Start date Start date
  • Tags Tags
    Explain Plot
Join the discussion
Registration is free. Ask a follow-up in this thread, or start your own.
1 reply · 2K views
Navier-Stokes
Messages
2
Reaction score
0
This is a plot for understanding the stability of flows through the orr sommerfeld equation.
However, I find it really hard to understand. The plot by itself is a little weird, what is it trying to convey?
Spectrum_OS.jpg
 
Physics news on Phys.org
I feel like I typically see these two axes flipped, but the image is a representation of the eigenvalue spectrum where ##Im(\lambda)## is a frequency and ##Re(\lambda)## is a growth rate (as generally ##c## is assumed to be complex, ##c = c_r + ic_i##). If ##Re(\lambda) > 0## then that eigenvalue is unstable.