Finding the total charge from the graph

Join the discussion
Registration is free. Ask a follow-up in this thread, or start your own.
3 replies · 13K views
red1312
Messages
20
Reaction score
1
Hi
I hope this the right place to put my question
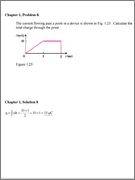
image.jpg


I didn't understand how it became like this

Thank you
 
Engineering news on Phys.org
A current of 1 A during one second means that 1 Coulomb has passed by.
If the current is constant, all you have to do is multiply current and time to get charge.
For example in the period 1-2 ms the current is constant, so the charge is 1 ms x 10 mA = 10 ##\mu##C
Which is also the area in the graph under the red line from 1-2 ms.

For 0-1 you have a non-constant current and the area under the red line is 10 x 1 /2 in mA x ms .

--

Does this help ?
 
Thank you very much
I understood the first part
But sorry I didn't get it the last part which is the 1/2 ,,,

Thank you again
 
In the first msec the current increases from 0 to 10 mA. It isn't 10 mA all through this msec, so 10 x 1 would be too much by a factor of about 2 as you can see from geometry.
In this case the average current during the first msec is 5 mA and the factor of 2 is exact.
Could it be that you aren't all that familiar with integrals and that integrals represent an area ?

Basically all that's done is that we add up all the little bits of charge = ##\ \ ## i x ##\Delta##t ##\ \ ## for the period 0 - 1 ms and do so for very small time steps. In the limit ##\Delta##t ##\downarrow ##0, this becomes the integral ##\int i \ dt##
 
  • Like
Likes   Reactions: red1312