infinite.curve
- 23
- 1
Well, I am confused on insulin resistance and cellular signaling.
Know... Below is my understand:
Insulin resistance happens either when the paceraes does not produce enough of the protein insulin and another way resistance occurs is when the receptor is not functioning properly. Are there other ways of insulin resistance?
Also, how are different type of cells types differ in the amount of reactions? Like, what is the signaling in cell signaling that makes for a certain amount of stop if reaction?
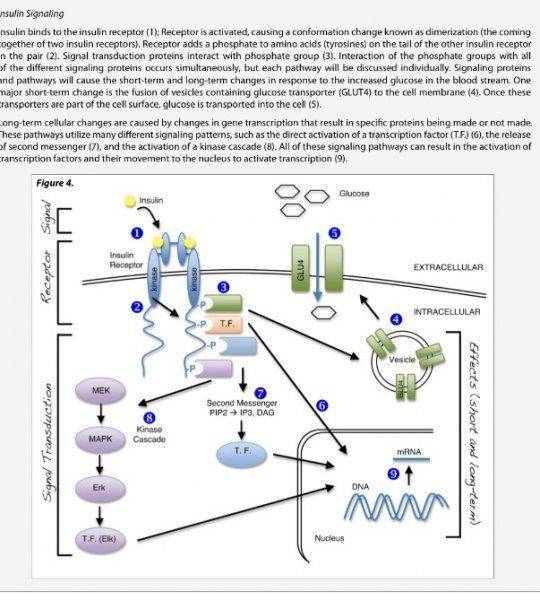
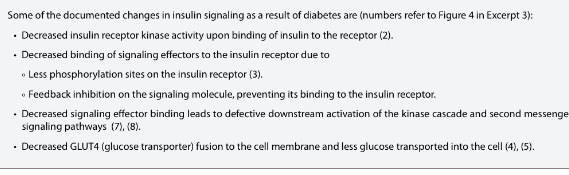
I have attached a picture to show the signaling in steps. Also, another picture just to see which do you guys think is the better investigation of the 4 that shows the best evidence for insulin resistance and cell signaling.
I personally thought that the first investigation was best representing of insulin resistance and cell signaling, but what is your opinion? Which one has more evidence?
http://file///C:/Users/HP8440p-PC/Desktop/FullSizeRender.jpg
http://file:///C:/Users/HP8440p-PC/Desktop/FullSizeRender%20(1).jpg
Know... Below is my understand:
Insulin resistance happens either when the paceraes does not produce enough of the protein insulin and another way resistance occurs is when the receptor is not functioning properly. Are there other ways of insulin resistance?
Also, how are different type of cells types differ in the amount of reactions? Like, what is the signaling in cell signaling that makes for a certain amount of stop if reaction?
I have attached a picture to show the signaling in steps. Also, another picture just to see which do you guys think is the better investigation of the 4 that shows the best evidence for insulin resistance and cell signaling.
I personally thought that the first investigation was best representing of insulin resistance and cell signaling, but what is your opinion? Which one has more evidence?
http://file///C:/Users/HP8440p-PC/Desktop/FullSizeRender.jpg
http://file:///C:/Users/HP8440p-PC/Desktop/FullSizeRender%20(1).jpg
Attachments


Last edited by a moderator: