Discussion Overview
The discussion revolves around selecting an appropriate smoothing algorithm for data collected from livestock ear sensors that measure heat emission. Participants explore various methods of data smoothing, including averaging and filtering techniques, and consider the characteristics of the data, such as its format and precision.
Discussion Character
- Exploratory
- Technical explanation
- Conceptual clarification
- Homework-related
Main Points Raised
- One participant seeks advice on which smoothing algorithm to use for their livestock data, emphasizing the need for reliable smoothed data.
- Another participant questions the meaning of "smoothing," asking if it refers to averaging or filtering for consistency in the data.
- Participants discuss the format of the data, which is in an Excel spreadsheet with temperature readings in Celsius and a precision of 0.01.
- There is mention of the data varying by time of day, leading to suggestions for low-pass filtering to achieve smoother curves.
- A participant proposes using a simple low-pass filter by averaging adjacent entries, while also mentioning the possibility of a more sophisticated weighted average approach.
- Questions arise regarding how to incorporate standard deviation into the smoothing process, with suggestions to use Excel functions for averages and standard deviation calculations.
- One participant shares a link to a digital filter coefficient calculator for those interested in more advanced filtering techniques.
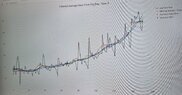
- Another participant expresses gratitude for the detailed responses and shares their data, asking for further input on the smoothing methods applied.
Areas of Agreement / Disagreement
Participants generally agree on the need for smoothing techniques but have not reached a consensus on the best method to use. Multiple approaches are discussed, and the conversation remains open to further exploration of the topic.
Contextual Notes
The discussion includes various assumptions about data characteristics and the potential complexity of smoothing algorithms. Specific mathematical steps for implementing the proposed techniques are not fully resolved.