Using Venn Diagram to Solve Precalculus Quantitative Methods Qs

Click For Summary
SUMMARY

The discussion focuses on solving a set of precalculus quantitative methods questions using a Venn diagram. The analysis involves 150 students, with specific enrollments in accounting (76), statistics (49), and economics (55). Key findings include that 7 students are taking both statistics and economics without accounting, 18 are attending statistics without the other courses, 134 students are enrolled in at least one course, and 16 students are not enrolled in any of the three courses.

PREREQUISITES
  • Understanding of Venn diagrams for set representation
  • Basic knowledge of set theory and intersections
  • Familiarity with precalculus quantitative methods
  • Ability to perform basic arithmetic operations
NEXT STEPS
  • Study advanced Venn diagram applications in statistics
  • Learn about set theory and its implications in mathematics
  • Explore problem-solving techniques for quantitative methods
  • Investigate the use of Venn diagrams in real-world data analysis
USEFUL FOR

Students in precalculus, educators teaching quantitative methods, and anyone interested in applying Venn diagrams to solve complex problems.

MarkFL
Gold Member
MHB
Messages
13,284
Reaction score
12
Here is the question:

Very difficult precalculus quantitative methods questions, please help!?

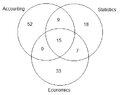
Of 150 students registered at a local university, 76 are attending an accounting course, 49 are taking statistics, 55 in economics, 24 attending the accounting and the statistics course, 22 registered in both statistics and economics courses and 15 are taking all three courses. (A Venn diagram may prove useful)

1) how many students are taking both the statistics and the economics courses without taking the accounting course?

2) how many students are attending the statistics course but nether the accounting nor the economics courses?

3) how many students are taking the accounting course or the statistics course or the economics course?

4) how many of these 150 registered students are not taking any of these three courses?

I have posted a link there to this topic so the OP can see my work.
 
Physics news on Phys.org
Hello j,

I have drawn a Venn diagram and filled it in, which I will explain:

View attachment 937

I began with the fact that we are told 15 are taking all 3 courses, so I wrote 15 in the intersection of all 3 sets, representing the 3 courses.

Next, I looked at the statement that 22 registered in both statistics and economics, and 15 of those are already accounted for in the first step, so that leaves 7 to go where statistics and economics intersect but outside of accounting.

Next, I looked at the statement that 24 are attending accounting and statistics, and 15 of those are already accounted for in the first step, so that leaves 9 to go where statistics and accounting intersect but outside of economics.

No statement is made regarding the number attending accounting and economics, so I put 0 where accounting and economics intersect outside of statistics.

Next, I looked at the statement that 55 are in economics, and since 15 + 7 = 22 are already accounted for, this leaves 33 to write in economics but outside of the other two courses.

Next, I looked at the statement that 49 are in statistics, and since 15 + 9 + 7 = 31 are already accounted for, this leaves 18 to write in statistics but outside of the other two courses.

Lastly, I looked at the statement that 76 are in accounting, and since 15 + 9 = 24 are already accounted for, this leaves 52 to write in accounting but outside of the other two courses.

Now we are able to answer the questions:

1.) How many students are taking both the statistics and the economics courses without taking the accounting course?

We see this is 7.

2.) How many students are attending the statistics course but neither the accounting nor the economics courses?

We see this is 18.

3.) How many students are taking the accounting course or the statistics course or the economics course?

Adding all the numbers, we find this number is 52 + 9 + 18 + 15 + 7 + 33 = 134.

4.) How many of these 150 registered students are not taking any of these three courses?

We see this is 150 - 134 = 16.
 

Attachments

  • jvenn.jpg
    jvenn.jpg
    12.4 KB · Views: 128

Similar threads

Replies
1
Views
2K
Replies
3
Views
12K
  • · Replies 3 ·
Replies
3
Views
2K
  • · Replies 10 ·
Replies
10
Views
5K
  • · Replies 1 ·
Replies
1
Views
3K
  • · Replies 11 ·
Replies
11
Views
6K
  • · Replies 13 ·
Replies
13
Views
5K
  • · Replies 65 ·
3
Replies
65
Views
14K
  • · Replies 1 ·
Replies
1
Views
3K
  • · Replies 2 ·
Replies
2
Views
3K