Modelling of two phase flow in packed bed (continued)

Join the discussion
Registration is free. Ask a follow-up in this thread, or start your own.
427 replies · 36K views · last reply
Chestermiller said:
This looks like a major improvement. Is the only difference the equation used to calculate the Re? It doesn't seem possible.
Yep you're right its not possible. I was mistakenly using the inlet molar flow to calculate the non-boundary position Reynolds Numbers. In switching to your new Re formulation I noticed that mistake

The CO2 mass buildup trend is correct in that the plug of CO2 increases in 'width' over time. Is that actually an issue that it seems to stay at a constant 100kg/m3?

In checking the area values I've got one point of confusion. What is the difference between ##A_s## and ##a_s##? ##A_s## seems to be the particle surface area per unit volume: $$A_s = \frac{6}{d_p}(1-\epsilon)$$

and ##a_s## is the particle surface area per unit superficial volume of column. What is the difference between this and ##A_s##? ##a_s## might be $$a_s = \frac{4\pi r^2}{A_c\Delta z}(1-epsilon)$$?

In regards to where each are used, it seems that ##A_s## will be used everywhere here, so we don't seem to have a need for ##a_s##?
 
Engineering news on Phys.org
casualguitar said:
Yep you're right its not possible. I was mistakenly using the inlet molar flow to calculate the non-boundary position Reynolds Numbers. In switching to your new Re formulation I noticed that mistake

The CO2 mass buildup trend is correct in that the plug of CO2 increases in 'width' over time. Is that actually an issue that it seems to stay at a constant 100kg/m3?
No. See their Fig. 3.
casualguitar said:
In checking the area values I've got one point of confusion. What is the difference between ##A_s## and ##a_s##? ##A_s## seems to be the particle surface area per unit volume: $$A_s = \frac{6}{d_p}(1-\epsilon)$$
That is the equation for ##a_s##, the particle surface per unit volume of column. ##A_s## is the particle surface per tank. $$A_s=A_c\Delta z a_s=\frac{6}{d_p}(1-\epsilon)A_c\Delta z$$
casualguitar said:
In regards to where each are used, it seems that ##A_s## will be used everywhere here, so we don't seem to have a need for ##a_s##?
Correct.
 
Chestermiller said:
No. See their Fig. 3.

That is the equation for ##a_s##, the particle surface per unit volume of column. ##A_s## is the particle surface per tank. $$A_s=A_c\Delta z a_s=\frac{6}{d_p}(1-\epsilon)A_c\Delta z$$
Ah whoops yes I agree with the above, and I am using the correct ##A_s## value. Typo by me. Ok then its possibly time to add in the last few small bits (non constant heat capacity, non constant viscosity, etc)? I have the functions written for all of those. I don't think it will change the output much though. A reasonable next (final?) step?
Chestermiller said:
Correct.
Great

EDIT: Oh and I'll make that change you mentioned about including the mass flow rate derivative as an integrated variable

So now that the model is effectively ready to be used (you might disagree with that), I think it would be useful to run a number of simulations to show how some performance parameters vary with initial and boundary conditions (ICs/BCs), such as separation efficiency or CO2 captured per unit of refrigeration. Do you think it is worthwhile to do this kind of 'factorial analysis'?
 
Last edited:
casualguitar said:
Ah whoops yes I agree with the above, and I am using the correct ##A_s## value. Typo by me. Ok then its possibly time to add in the last few small bits (non constant heat capacity, non constant viscosity, etc)? I have the functions written for all of those. I don't think it will change the output much though. A reasonable next (final?) step?

Great

EDIT: Oh and I'll make that change you mentioned about including the mass flow rate derivative as an integrated variable

So now that the model is effectively ready to be used (you might disagree with that), I think it would be useful to run a number of simulations to show how some performance parameters vary with initial and boundary conditions (ICs/BCs), such as separation efficiency or CO2 captured per unit of refrigeration. Do you think it is worthwhile to do this kind of 'factorial analysis'?
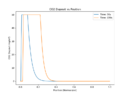
You need to again confirm that the overall CO2 mass balance is satisfied. I'm also wondering why we get a peak of 100, and they get a peak of 60. Try 15 tanks to see whether the added axial dispersion spreads the deposited CO2 out over a broader region.

As far as applying the model, I leave it up to you to decide cases to consider, although your thesis advisor should have input to this.
 
Chestermiller said:
Try 15 tanks to see whether the added axial dispersion spreads the deposited CO2 out over a broader region.
Seems to fail at around 330K. There isn't any phase change happening around there so I'm not sure why that happens. Looking into it
 
Chestermiller said:
15 tanks should run more easily than 30 tanks. Sounds like a variable dimensioning/storage issue.
Hi Chet! I've returned to the CO2 model and was hoping to discuss it with someone. You're the person that I've had the most discussion with on this so I was hoping I could continue this for a short while if thats ok with you! The simulation has progressed since our last discussion but there are some parts that I am unsure about. I just have some questions I'd like to discuss with someone. If this is ok with you, I can bring you up to speed on this
 
casualguitar said:
Hi Chet! I've returned to the CO2 model and was hoping to discuss it with someone. You're the person that I've had the most discussion with on this so I was hoping I could continue this for a short while if thats ok with you! The simulation has progressed since our last discussion but there are some parts that I am unsure about. I just have some questions I'd like to discuss with someone. If this is ok with you, I can bring you up to speed on this
I'll do my best to answer your questions, but my memory of this work is fading.
 
My apologies for the information dump below - these are the equations being solved and the initial/boundary values. Along with some comments at the end

And here is the model/experimental data we were tuning to at the time: https://www.sciencedirect.com/science/article/abs/pii/S0009250909000852

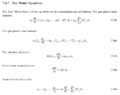
Here are our model equations:
The gas phase mole balance
\begin{equation}
m_j\frac{dy_i}{dt} = \dot{m}_{j-1}(y_{j-1} - y_j) - M_{i,j}''A_s + y_{i,j}\sum\limits_{i=1}^{n_c} M_{j,z}''A_s
\end{equation}

The gas phase heat balance:
\begin{equation}
m_j C_{p,j}\frac{dT_g}{dt} = \dot{m}_{j-1}C_{p,j-1}(T_{j-1} - T_j) - q_{g,I,j}A_s
\end{equation}

The bed heat balance:
\begin{equation}
M_sC_{p,s,j}\frac{dT_b}{dt} = q_{I,b,j}A_s
\end{equation}

Solid phase mass balance:
\begin{equation}
\frac{dM_i}{dt} = M_i''A_s
\end{equation}

Mass flow out of a tank:
\begin{equation}
\dot{m}_{j} = \dot{m}_{j-1} + \frac{\rho_m}{T_g}A_C\Delta z\frac{dT}{dt} - \sum\limits_{i=1}^{n_c} M_{i,j}''A_s
\end{equation}

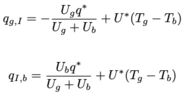
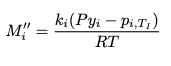
Here are our equations for ##M_{i,j}''##, ##q_{g,I}## and ##q_{I,b}##:
\begin{equation}
M_i'' = \frac{k_i(Py_i - p_{i,T_I})}{RT}
\end{equation}
\begin{equation}
q_{g,I} = -\frac{U_g q^*}{U_g+U_b} + U^*(T_g - T_b)
\end{equation}
\begin{equation}
q_{I,b} = \frac{U_b q^*}{U_g+U_b} + U^*(T_g - T_b)
\end{equation}
We also have correlations from BSL for the mass transfer coefficient ##k_i##, the fluid solid heat transfer coefficient ##h_{f,s}## and the sublimation pressure of CO2 ##p_{sub,co2}##:
\begin{equation}
h_{fs} = (2.19Re^{1/3} + 0.78Re^{0.619})Pr^{1/3}(\frac{k_g}{d_p})(\frac{\mu_{b,T_I}}{\mu_{0,T_I}})^{0.14}(1-\epsilon)
\end{equation}
\begin{equation}
k_{i} = (2.19Re^{1/3} + 0.78Re^{0.619})\frac{Sc^{1/3}}{d_p}D_{ab}(1-\epsilon_g)
\end{equation}
\begin{equation}
ln(\frac{P_{sub}}{P_t}) = \frac{T_t}{T}[a_1(1-\frac{T}{T_t)}+a_2(1-\frac{T}{T_t})^{1.9}+a_3(1-\frac{T}{T_t})^{2.9}]
\end{equation}

I'm not sure why the equation numbers are so high, but anyway -
Right now since the output I'm getting is not as expected, I have set the mass and heat transfer coefficients to be constants. The only other big change is that we are no longer including ##H_2O## in this model, just a stream of Nitrogen and ##CO_2##.

Here are the constants, initial and boundary values as they are currently:
Constants:
U_b = 100
U_g = 50
cp_CO2 = 37
ki_CO2 = 5 * 10 ** -4 # mol/m2.s (I'm actually still not fully sure about this unit)

Initial values:
initial_co2_mole_fraction = 0.00
initial_co2_deposit = 0.0
initial_gas_temperature = 123.15
initial_bed_temperature = 123.15

Boundary Values:
molar_flow_in = 0.002
y_CO2_inlet = 0.2
T_inlet = 300
 
Attachments
  • Printed page section 7.5.7 The Model Equations listing the ODEs solved in a packed-bed simulation: gas phase mole, gas heat, bed heat, solid mass balances and tank mass flow, numbered 7.45 to 7.49.
    Screenshot 2023-05-07 at 19.52.52.png
    14.8 KB · Views: 119
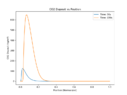
  • Line plot titled CO2 Deposit vs Position, with CO2 deposit in kg/m³ on the vertical axis (0 to about 650) against normalized position from 0 to 1. Two curves: Time 50s peaks near 120 at about 0.03, and Time 150s peaks near 650 at about 0.07, both decaying to zero by about 0.4.
    co2_unbounded.png
    7.1 KB · Views: 130
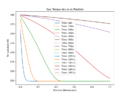
  • Line graph titled Gas Temperature vs Position, plotting temperature in K (about 120 to 300) against normalized position from 0 to 1 for curves labelled by time from 50 s to 2050 s; early curves drop sharply near position 0 to a plateau near 123 K, later curves fall gradually to about 277 K at position 1.
    position_versus_gas_temperature.png
    15.6 KB · Views: 135
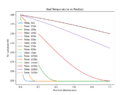
  • Line plot of bed temperature in kelvin against normalized position from 0 to 1 at multiple times from 50 s to 2050 s, with temperatures falling from about 300 K toward about 123 K at later times.
    position_vs_bed_temperature.png
    15.2 KB · Views: 142
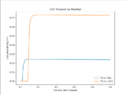
  • Line plot of CO2 deposit (kg/m³) against normalized position for two times, 50 s and 150 s. Both curves rise sharply to a plateau near 50 kg/m³ at the inlet and then fall toward zero; the 150 s curve is shifted further along the position axis.
    co2_deposition_vs_position_kg.png
    8.8 KB · Views: 155
  • Equation: ln(P_sub / P_t) = (T_t / T) [a1(1 - T/T_t) + a2(1 - T/T_t)^1.9 + a3(1 - T/T_t)^2.9]
    Screenshot 2023-05-07 at 19.59.13.png
    2.1 KB · Views: 139
  • Equation h_fs = (2.19Re^(1/3) + 0.78Re^(0.619))Pr^(1/3)(k_g/d_p)(mu_b,T_f/mu_0,T_l)^0.14(1 - epsilon)
    Screenshot 2023-05-07 at 19.58.42.png
    2.6 KB · Views: 125
  • Equation for the mass transfer coefficient k_i = (2.19Re^(1/3) + 0.78Re^(0.619)) times Sc^(1/3) divided by d_p, times D_ab times (1 - epsilon_g).
    Screenshot 2023-05-07 at 19.58.25.png
    2.1 KB · Views: 124
  • Screenshot 2023-05-07 at 19.55.56.png
    Screenshot 2023-05-07 at 19.55.56.png
    3.1 KB · Views: 123
  • Screenshot 2023-05-07 at 19.55.05.png
    Screenshot 2023-05-07 at 19.55.05.png
    4.2 KB · Views: 132
The output looks like this -
The output looks like this, for n = 200:
Line plot titled Gas Temperature vs Position, showing temperature in K against normalized position for times 50s to 2050s; profiles drop from about 300 K toward about 123 K near the inlet and flatten over time.

Line plot titled Bed Temperature vs Position: temperature in K against normalized position from 0 to 1 for 16 time steps from 50 s to 2050 s. Profiles fall from about 300 K at the inlet, with early curves dropping to about 123 K and later ones staying near 250 K at the outlet.


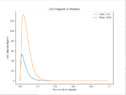
Line graph titled CO2 Deposit vs Position, with CO2 deposit in kg/m³ on the y-axis (0 to about 650) against normalized position from 0 to 1. Blue curve for Time 50s peaks near 120 at a position of about 0.03 and decays to zero by about 0.25. Orange curve for Time 150s peaks near 650 at about 0.07 and decays to zero by about 0.35.


I wanted to incude this last plot showing every position (all 200) and how they behave over time. Clearly the CO2 mole fraction output isnt right. The other plots dont actually look too bad though.
Four-panel line plot grid of simulated time series for 200 bed positions: CO2 mole fraction and CO2 deposit (mol) against time (s) on top, gas and bed temperature (K) against time (s) below.

In regards to the position vs temperature plots higher up, there doesnt seem to be any constant temperature zone which is present in Tuinier et al.

I apologise for the information dump but yes I would just like to open up dialogue here again as I found it hugely beneficial last time to have someone to have a back and forth with.

Is the above information sufficient or should I provide further info on this?

EDIT: One point I forgot to mention - in the gas/bed temperature vs position plots, I have printed time values. You can see that the temperature profile acually stops changing after a while and this is before the entirety of the bed has reached the inlet gas temperature
 
Last edited:
casualguitar said:
The output looks like this -
The output looks like this, for n = 200:
View attachment 326119
View attachment 326120

View attachment 326121

I wanted to incude this last plot showing every position (all 200) and how they behave over time. Clearly the CO2 mole fraction output isnt right. The other plots dont actually look too bad though.
View attachment 326116
In regards to the position vs temperature plots higher up, there doesnt seem to be any constant temperature zone which is present in Tuinier et al.

I apologise for the information dump but yes I would just like to open up dialogue here again as I found it hugely beneficial last time to have someone to have a back and forth with.

Is the above information sufficient or should I provide further info on this?

EDIT: One point I forgot to mention - in the gas/bed temperature vs position plots, I have printed time values. You can see that the temperature profile acually stops changing after a while and this is before the entirety of the bed has reached the inlet gas temperature
What do the results look like if you run the model with the mass transfer coefficient set to zero?
 
Chestermiller said:
What do the results look like if you run the model with the mass transfer coefficient set to zero?
Hi Chet, setting ki_CO2 = 0 and letting n=200 results in these plots:
Four-panel plot grid from a packed bed simulation over 0 to 500 s: CO2 mole fraction rises from 0 to 0.2, CO2 deposit stays at 0 mol, and gas and bed temperatures rise from about 125 K toward 300 K across many curves.


Two line plots of heat flow against time from 0 to 500 s: left panel QGI (W) from about 3500 down toward 0, right panel QIB (W) from 0 down to about -3500, with many coloured curves of differing shape.

Line plot titled Bed Temperature vs Position: temperature in K against normalized position from 0 to 1, with five curves for times 50s to 450s. Each drops sharply near position 0 and flattens at about 123 K by position 0.2.

Line plot titled Gas Temperature vs Position: temperature in K against normalized position for times 50s to 450s; each curve drops sharply near position 0 and flattens near 123 K beyond about 0.2.


The co2 mole fraction rises to 0.2 which is the inlet mole fraction, so this looks ok. There is no CO2 buildup on the bed as expected. The temperature profiles also generally look ok although there is no constant temeprature zone.

For reference, the h_desublimation_CO2 is set to 26,000 J/mol currently. Just now I tried setting it to 0 and 200,000, neither of which changed the temperature profiles appreciably
 
casualguitar said:
Hi Chet, setting ki_CO2 = 0 and letting n=200 results in these plots:
View attachment 326147

View attachment 326148
View attachment 326149
View attachment 326150

The co2 mole fraction rises to 0.2 which is the inlet mole fraction, so this looks ok. There is no CO2 buildup on the bed as expected. The temperature profiles also generally look ok although there is no constant temeprature zone.

For reference, the h_desublimation_CO2 is set to 26,000 J/mol currently. Just now I tried setting it to 0 and 200,000, neither of which changed the temperature profiles appreciably
Why does the CO2 mole fraction rise so rapidly? What is the gas residence time in the bed?

I feel that the problem is related to the CO2 mass transfer, particularly when the conditions are such that there is no longer CO2 remaining deposited on the bed.
 
Chestermiller said:
Why does the CO2 mole fraction rise so rapidly? What is the gas residence time in the bed?
I think due to the high flow. The inlet total molar flow for that plot was 0.002mol/s.

Here is a flow 10 times smaller. ##\dot{m_{in}}## = 0.0002mol/s
Four-panel simulation plot over 0 to 500 s: CO2 mole fraction rising from 0 to 0.2 for many overlapping curves, CO2 deposit flat at zero, and gas and bed temperatures rising from about 123 K to about 260 K and 250 K for the top curves.

Hmm to calculate gas residence time in the bed, could we do something like:
\begin{equation}
t_{residence} = \frac{L_{BED}}{v_{gas}}
\end{equation}

The velocity of the gas is:
\begin{equation}
v_{gas} = \frac{\dot{m_{in}}}{\rho A}
\end{equation}

where ##\dot{m_{in}}## is in mol/s, ##\rho## is in mol/m3 and A is in ##m^2##

For ##L_{BED}## = 0.3m:
##v_{gas}## = 0.0002/(36.36*0.00096) = 0.005m/s

Which gives a ##t_{residence}## value of ##52.63s##Just note at this point I'm using the bed dimensions, bed initial temperature, inlet gas temperature and inlet gas CO2 mole fraction from Tuinier et al. The inlet flow, mass transfer coefficient, and heat transfer coefficients are currently not the same. I can switch to the tuinier inlet mass flux now of 0.24kg/m2.s if the above is reasonable?
 
There's something wrong with how the release of the CO2 from the bed is handled. If there is a driving force for removal but there is no CO2 left on the bed, the flow of CO2 from the bed to the gas has to be zero. That means that the mass balance equation for the CO2 in the gas has to allow for this. Is it?
 
Chestermiller said:
There's something wrong with how the release of the CO2 from the bed is handled. If there is a driving force for removal but there is no CO2 left on the bed, the flow of CO2 from the bed to the gas has to be zero. That means that the mass balance equation for the CO2 in the gas has to allow for this. Is it?
No it doesn't allow for it. Right now the value can go below zero and does. Originally I had a conditional statement in the integrator that said "if the amount of CO2 in the bed goes below zero, set it to zero". Then I moved this statement to post-processing, so now I'm just plotting the CO2 deposition values that are above zero, but the solution from the integrator does contain negative values. Are either of these approaches ok, or should we somehow allow for it directly in the mass balance equation?

Right now the plots are unaffected by this (I think) since the mass transfer coefficient is zero thoughEdit: Sorry my apologies - I previously mentioned that there was no constant temperature zone. There is a constant temperature zone when the mass transfer coefficient is a non-zero value.

For reference, here's the CO2 buildup and other output when I dont post-process it to only show values greater than zero, when the mass-transfer coefficient is non-zero:
Four-panel line plot grid of simulation outputs against time (0 to 500 s): CO2 mole fraction, CO2 deposit (mol), gas temperature (K) and bed temperature (K), with many coloured curves per panel for different bed positions.

The blue line in the CO2 buildup plot is position 0, the orange one is position 1, if we continue on this plot the other positions drop off to negative values similarly. The mole fraction of CO2 goes above the inlet molar concentration of CO2. The temperature plots also look unusual

Heres the gas temperature plot, just illustrating that the constant temperature zone is present:
Line plot titled Gas Temperature vs Position: temperature in K against normalized position from 0 to 1 for times 50s to 450s; each curve drops from about 210 K to about 123 K, with a plateau near 195 K that extends further as time increases.


As you were saying there is likely an issue with how CO2 is released from the bed. How should we allow for the CO2 deposition value only being positive in the mole balance?

As mentioned, I am just post-processing the solution at the moment to remove the negative values. I can set the value to have a minimum value of zero inside the integrator though. Although I'm not sure if this is actually different to doing what I'm doing currently
 
Last edited:
We must set ##\frac{dM_i}{dt}=0## if ##M_i\leq 0## and ##M_i^"<0##, which is equivalent to ##M_i\leq 0## and ##(Py_{i}-p_{i,T_I})<0##. I've been trying to figure out a simple way of doing this in coding without use of IF statements.
 
There is an equivalent vectorised option in pythons numpy library called "where". Its just a vectorised if statement package though. I could replace the existing ##\frac{dM_i}{dt}## code lines (the boundary one and the internal nodes one) with something like this:

##\frac{dM_i}{dt} = np.where((M_i <= 0)## & ##(P * y_i - p_{i,T_I} < 0), 0, M_i'' * A_s)##

Which just says if the first two conditions are true then ##\frac{dM_i}{dt} = 0##, else ##\frac{dM_i}{dt} = M_i'' * A_s##

What is the reason that an IF statement isn't suitable here?

Edit: Just a note - heres the output with the above implemented. It does limit the CO2 deposited to a minimum of zero, but the mole fraction and temperature profiles are not right
Four-panel line plot of simulation outputs against time from 0 to 2000 s: CO2 mole fraction, CO2 deposit (mol), gas temperature (K) and bed temperature (K). Many coloured curves show sigmoid breakthrough-style rises, with a few outlier curves flattening early or dropping.


Just noting also that if the mass transfer coefficient is set to zero with the new code addition then the output looks reasonable again:
Four-panel plot of simulation results against time from 0 to 2000 s: CO2 mole fraction rising from 0 to 0.200, CO2 deposit flat at 0 mol, and gas and bed temperatures rising from about 125 K to about 290 K at different positions.
 
Last edited:
Is ##A_s## the bed surface area (m^2) per tank and ##M_I## the moles of CO2 deposited per tank? If so, pleases try to impose the following: If ##M_i<0.1 A_s## and ##M_{i}^"\leq 0##, reset ##M_i^"## to zero. This applies to the realistic flow rates.
 
Last edited:
Chestermiller said:
Is ##A_s## the bed surface area (m^2) per tank and ##M_I## the moles of CO2 deposited per tank? If so, pleases try to impose the following: If ##M_i<0.1 A_s## and ##M_{i}^"\leq 0##, reset ##M_i^"## to zero. This applies to the realistic flow rates.
Yes. Here is the output when this is imposed:
##M_i<0.1 A_s## and ##M_{i}^"\leq 0##, reset ##M_i^"## to zero
Where ##A_s =A_c\Delta z a_s=\frac{6}{d_p}(1-\epsilon)A_c\Delta z = 0.0032m^2##, the molar flow is 0.002mol/s and k_i = 5 * 10 ** -4 mol/m2.s:
Two side-by-side line plots over time from 0 to 2000 s: left panel titled QGI, y-axis OGI (W) from 0 to about 2300, with one curve starting high and decaying to a steady value near 1350 W; right panel titled QIB, y-axis QIB (W) from -2500 to 0, with curves decaying toward steady values, one settling near -1350 W.

Line plot of bed temperature in kelvin against normalized position from 0 to 1 for five times, 50 s to 450 s. Each curve rises sharply near position 0 to a peak near 190 to 195 K, then falls to a plateau near 123 K, with the drop moving further along the bed as time increases.

Line plot titled Gas Temperature vs Position with temperature in K on the vertical axis (about 120 to 210) against normalized position from 0.0 to 1.0. Five curves for times 50s to 450s show a sharp drop near the inlet and a moving front that shifts rightward with time, flattening near 123 K.

Line plot titled CO2 Deposit vs Position, with CO2 deposit in mol on the vertical axis (0 to about 0.009) against normalized position from 0 to 1. Two curves: Time 50s (blue) peaks near 0.0035 at position about 0.03 and falls to zero by about 0.3; Time 150s (orange) peaks near 0.0088 at position about 0.04 and falls to zero by about 0.4.

Four line plots of simulated packed bed time series, each with many overlapping curves: CO2 mole fraction, CO2 deposit (mol), gas temperature (K) and bed temperature (K), all against time (s) from 0 to 2000.


Is the reason for the ##0.1A_s## constraint so that we dont run into any case where ##M_i## <0? In a case where ##M_i''## is large this may occur

Just a note - this is n=200. The output is very different for lower n (n=20 or so). I can clean up the plotting to plot say 10% of the total positions if needed
 
Attachments
  • Line plot titled CO2 Deposit vs Position with two curves, Time 50s and Time 150s. Y-axis CO2 Deposit (kg/m³) from 0 to about 130; x-axis Position (Normalized) from 0 to 1. Both curves peak near position 0.02 to 0.04 and decay to zero by about 0.4; the 150s curve peaks near 133, the 50s curve near 54.
    Screenshot 2023-05-10 at 12.02.48.png
    8.9 KB · Views: 127
Last edited:
casualguitar said:
Yes. Here is the output when this is imposed:

Where ##A_s =A_c\Delta z a_s=\frac{6}{d_p}(1-\epsilon)A_c\Delta z = 0.0032m^2##, the molar flow is 0.002mol/s and k_i = 5 * 10 ** -4 mol/m2.s:
View attachment 326285
View attachment 326286
View attachment 326287
View attachment 326289
View attachment 326290

Is the reason for the ##0.1A_s## constraint so that we dont run into any case where ##M_i## <0? In a case where ##M_i''## is large this may occur
Yes. Do you think 0.1 is too large. Why didn't you run the calculation for a realistic molar flow rate?

What are your thoughts on whether the new plots were closer to your expectations?
 
Chestermiller said:
Yes. Do you think 0.1 is too large. Why didn't you run the calculation for a realistic molar flow rate?

What are your thoughts on whether the new plots were closer to your expectations?
No I think 0.1 is ok. Ah I was using a molar flow rate that fit the mass transfer coefficient. These two values affect the output quite a lot so if I change the molar flow I also need to adjust the mass transfer coefficient to get reasonable looking output.

The Tuinier et al reference uses 0.27kg/m2, which is 0.0083mol/s.

The Tuinier et al reference uses g = 1x10^-6 s/m. From post #233, the relationship between their g and our ##k_i## is:
\begin{equation}
k=\frac{1000RT}{M}g
\end{equation}
which gives ##k_{CO2}## = 0.047 for g = 1x10^-6.

Output using all of their values above looks like this (note the inlet temperature is 300K and the initial bed temperature is 123K):

The constant temperature zone is at approximately the right temperature, but the temperature seems to max out at around this temperature, rather than increase to the inlet gas temperature of 300K:
Line plot titled Gas Temperature vs Position: temperature in K (120 to 200) against normalized position (0 to 1) for times 50s, 150s, 250s, 350s and 450s. Each curve shows a cold front moving from left to right, dropping to about 123 K, with the 450s curve staying near 195 K.

The bed temperature seems to start at 0K actually, but ignoring this the rest of the temperature profile seems to be about the same as the gas temperature profile. I'll look into this 0K issue now
Line plot titled Bed Temperature vs Position: temperature in K against normalized position from 0 to 1 at five times (50s, 150s, 250s, 350s, 450s). Each curve rises sharply near position 0 to about 190-195 K, then falls to about 123 K as a front moves toward position 1; the 450s curve stays near 195 K across the bed.

The heat transfer profile at the inlet position (the blue one) does not look right, and the profile is very different to the internal node profiles:

Two side-by-side line plots against time (s) from 0 to 2000, each with several coloured curves: left plot QGI (W) rising from 0 to about 6600 for one curve and others dropping to near 0 or about 1000 with oscillatory bands; right plot QIB (W) falling from 0 to about -6600 for one curve, with others near 0 or about -1000.


The CO2 buildup profile looks ok. We dont get the same max values as Tuinier but they dont specify the simulation conditions for their CO2 buildup plot:
Line graph titled CO2 Deposit vs Position: CO2 deposit in kg/m³ (0 to 200) against normalized position (0 to 1) at Time 50s and Time 150s; both curves rise sharply near 0, then fall to zero, the 150s curve reaching about 0.5.


Investigating this 0K and heat transfer profile issue now
EDIT: That was a typo in how I was plotting the bed temperature. The ##Q_{BI}##/##Q_{IG}## issue still stands though
 
Attachments
  • Four line plots over 0 to 2000 s showing many overlapping curves: CO2 mole fraction, CO2 deposit (mol), gas temperature (K) and bed temperature (K), with most curves rising or falling sharply around 0 to 400 s before levelling off.
    Screenshot 2023-05-11 at 14.48.57.png
    26.6 KB · Views: 131
Last edited:
Just one addition to the above - letting ki_CO2 = 0 results in output that looks as expected. So yes as you said its definitely related to how co2 is released from the bed:

Two side-by-side line plots versus time from 0 to 2000 s: left panel titled QGI, QGI (W) from 0 to about 14000, many decaying curves; right panel titled QIB, QIB (W) from 0 to about -14000, many curves rising toward zero.

Line plot titled Gas Temperature vs Position: temperature in K against normalized position from 0 to 1 for five times, 50s to 450s. Each curve starts at about 300 K near position 0 and drops to a plateau near 123 K, with the drop moving rightward as time increases.

The CO2 moves through the bed quickly as there is no desublimation:
Four-panel plot against time from 0 to 2000 s: CO2 mole fraction jumps to 0.2 almost immediately; CO2 deposit stays at zero; gas and bed temperature curves rise from about 125 K to 300 K, with later onsets for successive curves.
 
The issue is with MDR (as you said previously). The molar desublimation rate at the inlet position does not trend towards zero as the other positions do. I will come back to this later this evening and see if the MDR function is implemented differently at the boundary
Line plot titled Sublimation Rate, showing sublimation rate in mol/s against time in s for 25 sections; most sections spike and oscillate then drop to zero by about 300 s, while Section 1 falls to a sustained negative value near -0.0013.

Here's the function:
Screenshot of Python code in a code editor defining a function MDR(ki, T, psubco2, y_CO2) that computes numerator = ki*(P*y_CO2 - psubco2), denominator = R*T, and returns mi = numerator/denominator, with comment lines for the molar desublimation rate of CO2.
 
Hi Chet,

Just noting one other thing in regards to the CO2 flow through the bed (molar flow/molar holdup).

The molar flow out of the first tank is currently calculated as:
Code line in a monospace editor: mdot = molar_flow_in - (MDR_CO2*surface_area)

which is the molar flow into tank 1 minus the total amount of CO2 deposited/released in that tank

Similarly, the molar flow out of the internal tanks is as follows:
Code line: mdot -= MDR_CO2* surface_area, with the -= and * operators highlighted in orange.


It looks ok to me but I'm just confirming this is correct

EDIT: I know why the heat transfer profiles (QGI and QIB) look the way they do. The gas/bed temperature plots get stuck at around the sublimation temperature, meaning that there will always be high heat transfer between the inlet gas and the first tank. The remaining tanks are at almost the same temperature as the first tank which is why we only see high heat transfer in the first one. That doesn't solve the problem but it does explain the QGI/QIB plots

EDIT 2: Whoops!! The molar flow out of the tank is wrong! I'm going to take a look at this tomorrow when I have a clear head
 
Last edited:
Hi Chet,

Unfortunately the molar flow error didnt fix the output, although it did change it somewhat.

The molar flow out of a tank should have been defined as the below. It was previously this so I must have changed it somewhere along the way:
\begin{equation}
\dot{m}_j = \dot{m}_{j-1} + \frac{\rho_m \Delta z A_c}{T_g}\frac{dT}{dt} - (M_{CO_2}''*A_s)
\end{equation}

Further up in the code ##m_j## is defined as:
\begin{equation}
m_j = \frac{P}{RT_g}\epsilon A_C\Delta z
\end{equation}

So I now have:
\begin{equation}
\dot{m}_j = \dot{m}_{j-1} + \frac{\rho_m \Delta z A_c}{T_g}\frac{dT}{dt} - (M_{CO_2}''*A_s)
\end{equation}

which I've implemented as:
\begin{equation}
\dot{m}_j = \dot{m}_{j-1} + \frac{m_j \epsilon}{T_g}\frac{dT}{dt} - (M_{CO_2}''*A_s)
\end{equation}

Just posting this here in case I've done anything crazy there
 
Hi Chet, looking further into the CO2 desublimation rate function, these are plots of temperature versus sublimation pressure (the gas-solid curve), and then temperature versus desublimation rate for a range of ##k_i## values, and ##y_{CO2}## = 0.2 (as it is in Tuinier et al).

Note that for the sublimation pressure curve, for temperature values above the triple point temperature (216K), i've used the liquid-vapour curve. Is there an alternative here? We could possibly say: if T is less than the triple point temperature, use the sublimation pressure curve, if T is greater than the triple point temeprature, let sublimation pressure = some large number?
Line graph titled Sublimation Pressure of CO2 vs Temperature, with temperature in K from 80 to 400 on the x-axis and sublimation pressure in Pa (scaled by 1e7) on the y-axis; the curve stays near zero up to about 200 K, then rises steeply to about 4.6e7 Pa at 400 K.
Line plot of molar desublimation rate of CO2 in mol/(m2.s) against temperature in K from about 120 to 300 K, for five ki values (1e-3 to 5e-4), each curve flat near zero then falling below zero at higher temperatures.

Edit: just noting the simulation breaks if I let psubco2 = 1000000 for T > triple point temerpature
 
Hi Chet, one more finding:

I ran a range of ##k_{CO2}## values as they have a very significant effect on all of the output. Here they are:

##k_{CO2}## = ##5*10^-4##:
Line plot of gas temperature in kelvin against normalized position from 0 to 1, with five curves for times 50s, 150s, 250s, 350s and 450s; temperature falls steeply near position 0 and the 50s curve drops to about 125 K at position 1, while later curves stay higher.
Line plot titled CO2 Deposit vs Position, with position normalized from 0 to 1 on the x-axis and CO2 deposit in kg/m³ on the y-axis; two curves for Time 50s and Time 150s, the 150s curve peaking near 90 at about 0.14 before declining to about 21 at position 1.
Line plot titled CO2 Mole Fraction with many overlapping curves of CO2 mole fraction against time in seconds from 0 to 500, rising from about 0.0 to 0.35; dashed horizontal lines appear near the top at late times.


##k_{CO2}## = ##5*10^-5##:
Line plot titled Gas Temperature vs Position: temperature in K on the vertical axis against normalized position from 0 to 1, with five curves for times 50s to 450s, all falling from about 277 K and flattening to lower plateaus, with the front moving further along over time.
Screenshot 2023-05-17 at 09.51.43.png
Line plot titled CO2 Mole Fraction, with CO2 mole fraction from 0 to about 0.35 against time from 0 to 500 s; many curves rise from about 0.17 to about 0.33 and level off, while a few horizontal lines sit between 0.23 and 0.31.

##k_{CO2}## = ##5*10^-6##:
Screenshot 2023-05-17 at 09.53.41.png
Line plot titled Gas Temperature vs Position showing five curves of temperature in K against normalized position from 0 to 1 at times 50 s to 450 s; each profile falls from about 290-297 K at position 0 to a plateau near 123 K, with the drop moving rightward as time increases.

Line plot titled CO2 Mole Fraction: many coloured curves of CO2 mole fraction versus time from 0 to 500 s, starting near 0, jumping to about 0.20, then rising and levelling off at differing values between about 0.205 and 0.275.

So yes again you were right with your original thought that CO2 sublimation isn't working correctly. Actually I've printed the CO2 sublimation pressure values versus temperature and as temperature gets to high values the sublimation pressure does too, meaning that we should see high sublimation rates of CO2, but we dont (the CO2 deposition plot is horizontal at high temperatures).
 
Attachments
  • Line plot titled CO2 Deposit vs Position: CO2 deposit in kg/m³ on the y-axis (0 to 0.07) against normalized position 0 to 1 on the x-axis, for Time 50s and Time 150s. Both curves are zero near the origin, rise sharply, then level off.
    Screenshot 2023-05-17 at 09.55.11.png
    7.7 KB · Views: 142
My apologies for the long-winded posts (my head is a bit fried!). The first plot below is completely at odds with the second one is it not? These plots are from the same simulation
Line graph titled CO2 Deposit, plotting CO2 deposit (mol) against time (s) from 0 to 170 s, with a 1e-6 scale on the y-axis; many coloured curves rise linearly then drop sharply to zero at different times.


Line plot titled CO2 Deposit vs Position, with position (normalized) from 0 to 1 on the x-axis and CO2 deposit (mol) in units of 1e-6 on the y-axis. Blue curve at 50s rises from 0 near 0.02, levels off near 1.6e-6. Orange curve at 150s stays at 0 until about 0.08, rises steeply to about 4.8e-6 near 0.2, then stays roughly flat to 1.0.
 
Hi Chet,

Output is looking better now. Only issue really is that we're producing a lot more solid CO2. The profiles look ok though.

I reverted back to an older approach we had, where we used something like their "fudge factor". I also put in the previous correlation for ##k_{CO2}##.

The fudge factor looks like this and only applies for sublimation (not desublimation):
if ##P*y_{CO2}## < ##P_{sub,CO2}##:
##M_{CO2}''## = ##M_{CO2}''##*##(\frac{M_{CO2}}{M_{CO2}+0.1})##

Tuinier uses 0.1 as their fudge factor. I'm using 0.1 also currently. We previously also discussed converting this 0.1 to a value suitable for us (different units), like this:
factor = 0.1*1000*A_C*dz/mW_CO2

As we're now calculating ##k_{CO2}##, we can no longer use this as a tuning parameter, unless I'm wrong. I'm wondering if we can instead use this fudge factor to tune the amount of CO2 produced?

Here's the output from the above. Note the output is a bit rough looking because I have used n=15. The the simulation takes a lot longer to run now so I'll increase this again once we're happy with the output:

Gas temperature profile shows the constant temperature zone:
Line graph of Tg versus position for selected times: Time = 10s, 50s, 100s, 150s and 200s. Tg falls from about 315 at position 0 toward about 123 at position 1, with later times reaching the plateau further along.


The amount of CO2 on the bed in kg/m3. Tuinier et al had values closer to 50kg/m3 for 50s and 150s:
Line graph titled MCO2 versus position for selected times, showing MCO2 against position from 0 to 1 at Time = 10s, 50s, 100s, 150s and 200s; each curve rises to a peak then falls to zero, with the peak moving to higher positions at later times.


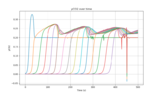
Lastly, ##y_{CO2}## for each position. Each position does level out at 0.2 which is the inlet concentration. There is a bit of fluctuation but this is possibly down to the sublimation process (I'll check this):
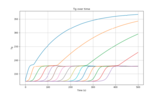
Line plot titled yCO2 over time, with yCO2 on the vertical axis from 0 to 0.3 and time in seconds from 0 to 500; many coloured curves rise in sequence from near zero to about 0.2 to 0.27, then level off near 0.2 to 0.25.


If this looks ok to you, do you think it is reasonable to use the "factor" to tune the amount of CO2 on the bed to Tuinier et al?

EDIT: If I take out the fudge factor and run it, the output looks like it did before (incorrect). I didn't think the fudge factor would have such an impact!
 
Attachments
  • Line plot titled Tg over time, with Tg on the y-axis (about 120 to 370) and Time (s) on the x-axis (0 to 500). One curve rises steadily to about 365, others rise more slowly to about 340, 295 and 228, and many curves plateau near 175-180 after stepped rises at staggered times.
    Screenshot 2023-05-17 at 14.07.29.png
    17.3 KB · Views: 162
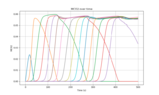
  • Line plot titled MCO2 over time, with time in seconds on the x-axis from 0 to 500 and MCO2 on the y-axis from 0 to 0.06; many coloured curves rise from zero in sequence, plateau near 0.056 to 0.058, and some drop back to zero.
    Screenshot 2023-05-17 at 14.06.54.png
    33.8 KB · Views: 136
  • Line plot titled 'yCO2 over time' showing many overlapping curves of CO2 mole fraction against time from 0 to 500 s; each curve rises from near 0 to about 0.2 or higher at a different time, with peaks near 0.27 and 0.25 and levelling at 0.2 for some curves.
    Screenshot 2023-05-17 at 14.06.23.png
    30.8 KB · Views: 170
  • Line plot of MCO2 versus time for each position, with time from 0 to 500 on the horizontal axis and MCO2 from 0.00 to 0.06 on the vertical axis; multiple coloured curves rise and fall in sequence, each peaking at a different time.
    Screenshot 2023-05-17 at 14.05.50.png
    9.7 KB · Views: 141
Last edited: