tantrik
- 13
- 0
Dear friends,
I'm unable to solve the following probability question. Please help me solve it. Thanks in advance. The answer given in the book is: 5/9 [for part (b)]. Don't know even if the answer is correct.
Suzi has taken up golf, and she buys a golf bag containing five different clubs. Unfortunately she does not know when to use each club, and so chooses them randomly for each shot. The probabilities for each shot that Suzi makes are shown below
Right club
--------------
Good shot - 2/3
Bad shot - 1/3
Wrong club
-----------------
Good shot - 1/4
Bad shot - 3/4
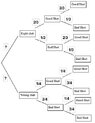
a) Use the above information to construct a tree diagram.
b) At one short hole, she can reach the green in one shot if it is 'good'. If her first shot is 'bad', it takes one more 'good' shot to reach the green. Find the probability that she reaches the green in at most two shots.
I drew the tree diagram given below. Don't know whether it is correct or not. Problem is what would be the values for P(right club) and P(wrong club). Still I don't know which outcomes should I take for finding the solution to part (b). Let me know what to do next.View attachment 5996
I'm unable to solve the following probability question. Please help me solve it. Thanks in advance. The answer given in the book is: 5/9 [for part (b)]. Don't know even if the answer is correct.
Suzi has taken up golf, and she buys a golf bag containing five different clubs. Unfortunately she does not know when to use each club, and so chooses them randomly for each shot. The probabilities for each shot that Suzi makes are shown below
Right club
--------------
Good shot - 2/3
Bad shot - 1/3
Wrong club
-----------------
Good shot - 1/4
Bad shot - 3/4
a) Use the above information to construct a tree diagram.
b) At one short hole, she can reach the green in one shot if it is 'good'. If her first shot is 'bad', it takes one more 'good' shot to reach the green. Find the probability that she reaches the green in at most two shots.
I drew the tree diagram given below. Don't know whether it is correct or not. Problem is what would be the values for P(right club) and P(wrong club). Still I don't know which outcomes should I take for finding the solution to part (b). Let me know what to do next.View attachment 5996