paulb203
- 196
- 76
- Homework Statement
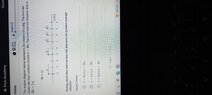
- During which time interval does the dog have the greatest average velocity (see attached photo for diagram)
- Relevant Equations
- v=s/t
Does the v with the arrow underneath stand for velocity vector?
If so, does the length of the arrow indicate the magnitude of the velocity?
Is arrow length usually specific (x cm, or y mm, or whatever, indicating a specific magnitude, sometimes to scale)? Or is it usually relative (longer or shorter than another arrow, indicating simply greater or lesser magnitude). Nb; the arrows in the diagram seem very specific.
The first arrow goes from -4 to -2.5 a length of 1.5m. What does that indicate?
I know the displacement for that first interval is 5m therefore the velocity is 2.5m/s, which is why I’m wondering.