jhonconnor
- 7
- 4
- TL;DR
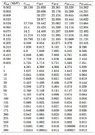
- I made a simulation of neutron-proton scattering phase shift to find the total cross-section, but the sim and exp data have a large difference of magnitude between them.
Well, I'm simulating a neutron-proton scattering phase shift. The equation that I solve numerically is the Phase function method and is
$$ \frac{d}{dr}[\delta_{i+1}] = \frac{2\mu}{\hbar^2}\frac{V(r)}{k^2}\sin(kr + \delta_i)$$
##\delta_i## is the phase shift for triplet and singlet state, ##\mu## is the reduced mass for neutron-proton, ##k=\sqrt{2\mu E_{cm}/\hbar^2}## is the wave number and ##V(r)## is the potential of interaction like Yukawa, Wood-Saxon, Square well potential, etc. I first find both scattering phase shift in degrees, putting ##y_{i+1} = 180/\pi## to make tables and graphs. Later, for ##\ell = 0## state the equation that relates phase shift with partial cross-section is
$$ \sigma_p = \frac{4\pi}{k^2}(\sin \delta_p)^2$$
At least, total cross-section is expressed as
$$ \sigma_{total} = \frac{3}{4}\sigma_t + \frac{1}{4}\sigma_s$$
where ##\sigma_t## and ##\sigma_s## is triplet and singlet cross-section respectively. But for some energy range is there such a large difference between sim and exp cross-section. I verify using "exp phase shift" and putting them into the equations, but the order of magnitude are the same that I obtain with my simulation. What is the reason for that? Note: ##k## have units of ##1/\mathrm{fm}## and in the table data is in Barn units.
Just try it with ##E_{lab}=##300 MeV ##\delta_t = 6.60## and ##\delta_s = –4.46## in degrees (with ##E_{cm} = m_pE_{lab}/(m_p+m_n)##)