Why am I getting the wrong conclusion from my spacetime diagram?

In summary, the reason why you are getting the wrong conclusion from your spacetime diagram could be due to a variety of factors. Some potential reasons could include incorrect assumptions or data, not fully understanding the concepts of spacetime, or not accounting for all variables in the diagram. It is important to thoroughly analyze and interpret the information presented in the diagram to ensure accurate conclusions are drawn.
  • #1
student34
639
21
On my diagram, a person is traveling in a spaceship to the right in red, which is displayed as a Minkowski diagram . At the origin (0,0) the person traveling travels by a stationary person. And the 2 blue lines are the worldlines of two blue stationary rocks.

But when I try to figure out what the distance is between the rocks from the frame of reference of the spaceship at (0,0), I get a distance wider than the proper length. What am I doing wrong?
Spacetime Question.jpg
 
Physics news on Phys.org
  • #2
student34 said:
On my diagram, a person is traveling in a spaceship to the right in red, which is displayed as a Minkowski diagram . At the origin (0,0) the person traveling travels by a stationary person. And the 2 blue lines are the worldlines of two blue stationary rocks.
All of this looks fine.

student34 said:
But when I try to figure out what the distance is between the rocks from the frame of reference of the spaceship at (0,0), I get a distance wider than the proper length. What am I doing wrong?
We can't possibly tell unless you show us your actual calculations.
 
  • #3
PeterDonis said:
All of this looks fine.We can't possibly tell unless you show us your actual calculations.
Without any calculations, it seems that at time = 0 the two blue world lines are actually wider apart for the moving observer than a measurement of them in the rest frame. Aren't they suppose to be closer together because of length contraction?
 
  • #4
student34 said:
What am I doing wrong?
At a guess, you calculated ##x'## for each rock at the same ##t## and took the difference, which is larger than the rest spacing by a factor of ##\gamma##. But two events with the same ##t## do not have the same ##t'##. The rocks are moving in the primed frame, and if you compare the position of one at one time to the position of the other at another time you do not get the separation. If you want their separation as measured in the primed frame you need to measure their positions in that frame at the same time in that frame. That is, you want the difference in ##x'## at the same ##t'##, not the same ##t##. That separation is smaller by a factor of ##\gamma##.
 
  • #5
student34 said:
Without any calculations, it seems that at time = 0 the two blue world lines are actually wider apart for the moving observer than a measurement of them in the rest frame. Aren't they suppose to be closer together because of length contraction?
Ok, I was wrong. You just measured the length of red ##x'## axis between the blue lines, which gets you ##\sqrt{\Delta x^2+c^2\Delta t^2}##. That is not the length of the line in reality - it's only the length of the line on the diagram. As you may recall from your last very lengthy thread, the Minkowski diagram is a distorted representation of the non-Euclidean Minkowski plane. That means you can't just measure lengths on the diagram and hope. You need to calculate.

Remember that the length of a spacelike line is ##\sqrt{\Delta x^2-c^2\Delta t^2}##, not ##\sqrt{\Delta x^2+c^2\Delta t^2}##.
 
Last edited:
  • Informative
  • Like
Likes vela and Dale
  • #6
student34 said:
Without any calculations, it seems
You can't just look at spacetime diagrams and judge by what "seems" to be the case. The geometry of Minkowski spacetime is not the same as the geometry of a Euclidean space, which is what your "seems" intuition is used to. You need to actually do the math.
 
  • Like
Likes malawi_glenn, vela and Melbourne Guy
  • #7
student34 said:
But when I try to figure out what the distance is between the rocks from the frame of reference of the spaceship at (0,0), I get a distance wider than the proper length. What am I doing wrong?View attachment 302707
The x-axis and the x'-axis have different scales.

Wikipedia said:
As illustrated in Fig 2-3, the boosted and unboosted spacetime axes will in general have unequal unit lengths. If U is the unit length on the axes of ct and x respectively, the unit length on the axes of ct′ and x′ is:[6]
##U'=U{\sqrt {\frac {1+\beta ^{2}}{1-\beta ^{2}}}}##
Source:
https://en.wikipedia.org/wiki/Spacetime_diagram#Mathematical_detailsYou can see length contraction in a Minkowski diagram in both directions in Fig. 7.10 on page 56 of the book "Freund, Jürgen (2008). Special Relativity for Beginners".

Google books preview using Chrome:
https://books.google.de/books?id=-Mw7DQAAQBAJ&lpg=PA52&hl=de&pg=PA56#v=onepage&q&f=false
 
  • Like
Likes student34
  • #8
As others have already said, you are likely ignoring the fact that Minkowski spacetime has a different geometry than Euclidean space. Instead of the Pythagorean theorem ##l^2 = x^2 + y^2## you have ##l^2 = x^2 - c^2 t^2##. In Euclidean space you can find the normalization of the axes by drawing a circle of radius one. Checking where the circle crosses an axis will give you the ”1” tick on the axis because of the Pythagorean theorem.

In Minkowski space you instead need to draw the hyperbola corresponding to ##1= x^2-c^2t^2##. Where this hyperbola intersects the ##x’## axis will correspond to ##x’=1##. Because of how a hyperbola works, this will occur at ##x>1##.
 
  • #10
student34 said:
On my diagram, a person is traveling in a spaceship to the right in red, which is displayed as a Minkowski diagram . At the origin (0,0) the person traveling travels by a stationary person. And the 2 blue lines are the worldlines of two blue stationary rocks.

But when I try to figure out what the distance is between the rocks from the frame of reference of the spaceship at (0,0), I get a distance wider than the proper length. What am I doing wrong?View attachment 302707
That's the problem with Minkowski diagrams. You must forget about reading them as if they were in a Euclidean plane. They are instead in a "Minkowskian plane". You have to construct the unit distances for your axes using the correponding time-like and space-like hyperbolae. Then you'll see that the distance measured in the primed system is indeed smaller by an inverse Lorentz factor than the distance measured in the unprimed frame, were the two rockets are both at rest.

See Fig. 2 (right panel) for the Minkowski diagram to illustrate length contraction in

https://itp.uni-frankfurt.de/~hees/pf-faq/srt.pdf
 
  • Like
Likes student34 and Sagittarius A-Star
  • #11
student34 said:
But when I try to figure out what the distance is between the rocks from the frame of reference of the spaceship at (0,0), I get a distance wider than the proper length. What am I doing wrong?View attachment 302707
In the following overlay of GeoGebra and your diagram, you can see scales at the axes.

SgrA-Spacetime Question-geogebra.jpg

##\beta \approx \tan (25.5) \approx 0.477##
##1/\gamma \ \approx 0.88##
##L = 3, \ \ \ L' = 2.64## (measured at events A and B).

Now consider a rod between events A and B, that is at rest in the spaceship and has the length M' = L'. Length contraction of the rod in the stationary frame:
##M' = 2.64, \ \ \ M = 2.32##.
 
  • Like
Likes student34 and vanhees71
  • #12
Sagittarius A-Star said:
The x-axis and the x'-axis have different scales.Source:
https://en.wikipedia.org/wiki/Spacetime_diagram#Mathematical_detailsYou can see length contraction in a Minkowski diagram in both directions in Fig. 7.10 on page 56 of the book "Freund, Jürgen (2008). Special Relativity for Beginners".

Google books preview using Chrome:
https://books.google.de/books?id=-Mw7DQAAQBAJ&lpg=PA52&hl=de&pg=PA56#v=onepage&q&f=false
Thanks, I did not know that they were different scales. It makes sense now.
 
  • Like
Likes vanhees71 and Sagittarius A-Star
  • #13
Ibix said:
Ok, I was wrong. You just measured the length of red ##x'## axis between the blue lines, which gets you ##\sqrt{\Delta x^2+c^2\Delta t^2}##. That is not the length of the line in reality - it's only the length of the line on the diagram. As you may recall from your last very lengthy thread, the Minkowski diagram is a distorted representation of the non-Euclidean Minkowski plane. That means you can't just measure lengths on the diagram and hope. You need to calculate.

Remember that the length of a spacelike line is ##\sqrt{\Delta x^2-c^2\Delta t^2}##, not ##\sqrt{\Delta x^2+c^2\Delta t^2}##.
I think this is wrong because on the x' axis ##\sqrt{\Delta x^2-c^2\Delta t^2}## should be ##\sqrt{\Delta x^2-0}##
 
  • #14
student34 said:
I think this is wrong because on the x' axis ##\sqrt{\Delta x^2-c^2\Delta t^2}## should be ##\sqrt{\Delta x^2-0}##
On the ##x## axis we have ##\Delta t = 0## (by definition), so the spacetime length reduces to the proper length ##|\Delta x|##.

On the ##x'## axis we have ##\Delta t' = 0## (by definition) but never ##\Delta t = 0##.
 
  • #15
student34 said:
I think this is wrong because on the x' axis ##\sqrt{\Delta x^2-c^2\Delta t^2}## should be ##\sqrt{\Delta x^2-0}##
On the x'-axis length is ##\sqrt{\Delta {x'}^2-0} = \sqrt{\Delta x^2-c^2\Delta t^2}##. Reason is that the squared spacetime-interval is invariant:
$$\Delta {x'}^2-c^2\Delta {t'}^2 = \Delta x^2-c^2\Delta t^2$$
 
  • #16
PeroK said:
On the ##x## axis we have ##\Delta t = 0## (by definition), so the spacetime length reduces to the proper length ##|\Delta x|##.

On the ##x'## axis we have ##\Delta t' = 0## (by definition) but never ##\Delta t = 0##.
I don't understand what you are saying here. Why can't ##\Delta t = 0## ?
 
  • #17
student34 said:
Why can't ##\Delta t = 0## ?
In the diagram of posting #11 you can see, that events A and B are simultaneously in the spaceship's frame, but not simultaneously in the "stationary" frame.
 
Last edited:
  • Like
Likes vanhees71
  • #18
student34 said:
I don't understand what you are saying here. Why can't ##\Delta t = 0## ?
Because you are on the ##x'## axis. No two points on the ##x'## axis have the same ##t## coordinate.
 
  • Like
Likes vanhees71
  • #19
vanhees71 said:
That's the problem with Minkowski diagrams. You must forget about reading them as if they were in a Euclidean plane. They are instead in a "Minkowskian plane". You have to construct the unit distances for your axes using the correponding time-like and space-like hyperbolae. Then you'll see that the distance measured in the primed system is indeed smaller by an inverse Lorentz factor than the distance measured in the unprimed frame, were the two rockets are both at rest.

See Fig. 2 (right panel) for the Minkowski diagram to illustrate length contraction in

https://itp.uni-frankfurt.de/~hees/pf-faq/srt.pdf
Thanks, the diagram is very helpful to visualize why the units are bigger on the x' axis. This is all starting to make sense now.
 
  • Like
Likes vanhees71
  • #20
PeroK said:
Because you are on the ##x'## axis. No two points on the ##x'## axis have the same ##t## coordinate.
Oh yes, I thought you meant in general.
 
  • Like
Likes vanhees71
  • #21
Here's another spacetime diagram that might help.

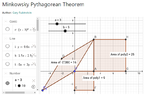
By using "rotated graph paper",
many calculations can be done by counting and doing very simple arithmetic.
The boxes in the grid ("light-clock diamonds") are based on the light-clock of the observer at rest who draws this diagram.

By forming the "causal diamond" where your events are opposite corners
and the diamond-edges are along the lightcone, the area of the diamond (in units of the light-clock diamond) gives the square-interval between those events. The square-root of the magnitude gives the "length" along the diagonal of the diamond.

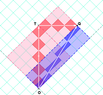
I tried to reconstruct the situation you have drawn.
It seems that your moving frame moves at ##v=(0.5)c##, and your rocks are at ##x=5## and ##x=8##.
By computing the areas, you can see that the moving frame measures a shorter distance between the parallel worldlines.

(t,x) coordinates: P1=(2.5, 5) and P2=(4,8)
The square-interval (using the ##(+,-,-,-)##-convention ) is ##(4-2.5)^2-(8-5)^2= -6.75##

Note: for ##v=(1/2)c##, we have ##\gamma=\frac{1}{\sqrt{1-v^2}}=\sqrt{4/3}##. Furthermore,
$$(\ell')^2=\frac{\ell^2}{\gamma^2}=\frac{9}{4/3}=(27/4)=6.75$$

1655049540868.png


If you choose nice numbers (like ##v=(3/5)c##, which have rational Doppler factors, here ##k=2##
(whereas ##v=(1/2)c## has ##k=\sqrt{3}##)), the arithmetic is easier (especially when used with nicer intervals, like 5 (rather than 3) for ##v=(3/5)c##) and the visualization of the ticks along the segments is easier... assuming the primary goal is to first have an understanding of what is going on... before moving on to solving more general problems.

With ##v=(3/5)c## (so, ##k=\sqrt{\frac{1+v}{1-v}}## and ##\gamma=\frac{1}{\sqrt{1-v^2}}=5/4##)
and ##\ell=5## (between ##x=5## and ##x=10##).
1655052563064.png


For more on this approach, consult my Insights (first link in my signature below).
 
Last edited:
  • Like
  • Informative
Likes vanhees71, student34 and Sagittarius A-Star
  • #22
robphy said:
By forming the "causal diamond" where your events are opposite corners
and the diamond-edges are along the lightcone, the area of the diamond (in units of the light-clock diamond) gives the square-interval between those events. The square-root of the magnitude gives the "length" along the diagonal of the diamond.
In the Minkowski diagram you can also construct an area (based on a non-rotated graph paper), which is the squared interval between those events. It is the area of the rhombus (symmetrical with regards to the light world lines), with the events at neighboring points, in the following link events C and B:
https://www.geogebra.org/m/dYyg5ZB8#material/ewe6t2BU

Proof:
https://www.geogebra.org/m/HCBWqpjY

See also:
http://www.dierck-e-liebscher.de/images/geometrie/minkowski-pythagoras.html
 
Last edited:
  • Like
Likes vanhees71, robphy and student34
  • #23
Sagittarius A-Star said:
In the Minkowski diagram you can also construct an area (based on a non-rotated graph paper), which is the squared interval between those events. It is the area of the rhombus (symmetrical with regards to the light world lines), with the events at neighboring points, in the following link events C and B:
https://www.geogebra.org/m/dYyg5ZB8#material/ewe6t2BU

Yes!
In fact, any area in the diagram is preserved by a boost (since the determinant of the boost equals 1).

One advantage of the "causal diamond" is that the events themselves (not just the size of the area) in the diamond have an invariant definition...
  • Along the timelike diagonal, the diamond is formed as
    the intersection
    of the future (light cone and interior) of the past vertex
    and the past of the future vertex.
    Physically, the events in that diamond can be influenced by the past vertex and can also influence the future vertex.
    When the diamond of CB is constructed in all spacetime diagrams,
    those set of events are the same, along with the size of the area,
    although the "shape" of the diamond will differ.
    (The shape is determined by the relative Doppler factors... as shown below.)

For the "coordinate rhombi" (my term) with edges along the coordinate tickmarks,
those rhombi make reference to the tickmarks of that observer.
The events along a rhombus edge are the same coordinate value for that observer (but not for other observers in general).
Of course, the two grids are compatible and can be obtained
by slicing them up into triangles are rearranging.

I think a key difference is that, once understood, the construction of the diamonds
and subsequent calculations based on counting diamonds are easier.
For example, one never has to explicitly calculate ##\gamma##.


For comparison with the diagram from your first link,
  • 1655084456203.png

  • here's my version of the Pythagorean theorem.
    1655084782877.png

    ##(area CT)^2-(area TB)^2=(area CB)^2=25-9=16##.

I think the area of the causal diamond of CB is clearly gotten
by easily counting the 16 diamonds in the rotated grid.

In fact, using only the diamonds in the causal diamond of CB,
observe the following.
  • With the red clock diamonds, diamond CB has u=8 and v=2,
    with aspect ratio ##u/v=8/2=k^2## so ##k=2##.
    Since ##k=\sqrt{\frac{1+v}{1-v}}##, then ##v=\frac{k^2-1}{k^2+1}=3/5##
    (in agreement with what is determined by ##TB/CT##).
    Since the area is ##uv=(8)(2)##, the square interval is 16
    (in agreement with what is determined by ##(CT)^2-(TB)^2=\left(\frac{u+v}{2}\right)^2-\left(\frac{u-v}{2}\right)^2=5^2-3^2##).
  • With the blue clock diamonds, diamond CB has u=4 and v=4,
    with aspect ratio ##u/v=4/4=k^2## so ##k=1##.
    Since ##k=\sqrt{\frac{1+v}{1-v}}##, then ##v=\frac{k^2-1}{k^2+1}=0##,
    which means that CB is at rest with respect to
    the observer along the timelike diagonal of the blue diamonds.
    Since the area is ##uv=(4)(4)##, the square interval is 16
    (in agreement with what is determined by ##\left(\frac{u+v}{2}\right)^2-\left(\frac{u-v}{2}\right)^2=4^2-0^2##)).

The blue clock diamond obtained by stretching the red diamond by a factor of k=2 in the forward direction and shrinking by that factor (so the area is unchanged) is a Lorentz boost in the eigenbasis… in light-cone coordinates.


For a more detailed example of a diagram and calculation using the diamonds
look at page 9 of my slides (from an old talk) describing an elastic collision
https://www.aapt.org/docdirectory/m...aper-CalculatingWithCausalDiamonds.pdf#page=9
On one diagram, it features 4 reference frames (the lab frame, the two frames for the initial particles, and one frame for one of the final particles)... the 5th frame is not yet determined until the problem is solved
...by counting diamonds,
 

Attachments

  • 1655084616049.png
    1655084616049.png
    15.5 KB · Views: 60
  • 1655084659013.png
    1655084659013.png
    21.8 KB · Views: 60
Last edited:
  • Like
  • Informative
Likes Sagittarius A-Star and vanhees71
  • #24
Sagittarius A-Star said:
Liebscher has a very nice book.

The Geometry of Time by Dierck-Ekkehard Liebscher

(Although the one Amazon review didn't like it,
I think it has many geometrical insights that are not found anywhere else.
As it says in the inside flap, " its aim is to show the connection with synthetic geometry".
If the reader is not interested in that aspect, then this work would not be appreciated by that reader.)

(In the book, the link to Reference 7 is outdated.)
 
  • Like
Likes Sagittarius A-Star and vanhees71
  • #25
It's of course clear that the usual Minkowski diagram and the "rotated graph paper" are finally equivalent. It's just using different coordinates for the Minkowksi plane: In the case of the Minkowski diagram one uses pseudo-Cartesian (Lorentzian) coordinates in the "rotated graph paper" the underlying coordinates behind this formulation of SR (Bondi calculus) are light-cone coordinates.

That areas occur is natural in hyperbolic geometry. It's because in the parametrization of the unit hyperbola ##(\cosh \eta,\sinh \eta)##, ##\eta## is an area, and that's why the inverse functions of the hyperbolic functions are called area functions (arsinh, arcosh, artanh).
 
  • Informative
  • Like
Likes Ibix, robphy and Sagittarius A-Star

1. Why does my spacetime diagram show different results than my calculations?

There could be several reasons for this discrepancy. One possibility is that there was an error in your calculations. Another possibility is that your diagram is not accurately representing the data or that you are not interpreting it correctly. It is important to carefully check your calculations and make sure your diagram is properly labeled and scaled.

2. How can I ensure that my spacetime diagram accurately represents my data?

To ensure accuracy, it is important to carefully label and scale your diagram. Make sure to include all relevant variables and units. Additionally, it can be helpful to double check your calculations and have someone else review your diagram to catch any potential errors.

3. What is the significance of the slope on a spacetime diagram?

The slope on a spacetime diagram represents the speed of an object. A steeper slope indicates a faster speed, while a flatter slope indicates a slower speed. Additionally, the slope can also indicate the direction of motion, with positive slopes representing motion towards the right and negative slopes representing motion towards the left.

4. How does time dilation affect a spacetime diagram?

Time dilation, a phenomenon predicted by Einstein's theory of relativity, can affect a spacetime diagram by causing time to appear to pass at different rates for observers in different frames of reference. This can result in differences in the time intervals shown on the diagram for different observers. It is important to account for time dilation when interpreting a spacetime diagram.

5. Can a spacetime diagram accurately represent objects moving faster than the speed of light?

No, a spacetime diagram cannot accurately represent objects moving faster than the speed of light. According to Einstein's theory of relativity, the speed of light is the maximum speed at which any object can travel. As a result, the slope of a spacetime diagram cannot exceed the slope representing the speed of light. Any object traveling faster than the speed of light would require a slope greater than this, making it impossible to accurately represent on a spacetime diagram.

Similar threads

  • Special and General Relativity
Replies
27
Views
2K
  • Special and General Relativity
Replies
5
Views
1K
  • Special and General Relativity
Replies
33
Views
1K
  • Special and General Relativity
Replies
7
Views
413
  • Special and General Relativity
Replies
6
Views
1K
  • Special and General Relativity
Replies
14
Views
772
  • Special and General Relativity
Replies
15
Views
446
  • Special and General Relativity
Replies
20
Views
1K
  • Special and General Relativity
Replies
21
Views
1K
  • Special and General Relativity
Replies
6
Views
835
Back
Top