Stargazing Solar Activity and Space Weather Update thread

AI Thread Summary
The discussion focuses on ongoing solar activity and space weather updates following the August 21, 2017, solar eclipse. Participants are encouraged to share significant solar events, including images and scientific articles. Currently, sunspot regions 2671 and 2672 are noted, with region 2672 expected to decline soon. Recent solar flares include M-class events, with predictions of active geomagnetic conditions and potential auroras at high latitudes. The conversation highlights the dynamic nature of solar observations and the importance of safety when viewing the sun.
  • #151
In the P.S. of the previous post the data was (local min for speed):
"speed: 424.2 km/sec
density: 2.1 protons/cm3
more data: ACE, DSCOVR
Updated: Today at 0200 UT "

Further ahead on July 22, speed overall relatively dropped (and some average density increase), however speed remains significantly relatively eleveted and density on the low side ...

Communications (on AM bands [MW, SW, LW] etc.) relatively cleared up today (for some reason this solar wind is not so magnetized ...). Just minor interference locally (spatio-temporarly) and at times, per band(s) ... (etc.). Overall it's a quiet day (seems, in those respects), so far ... ...

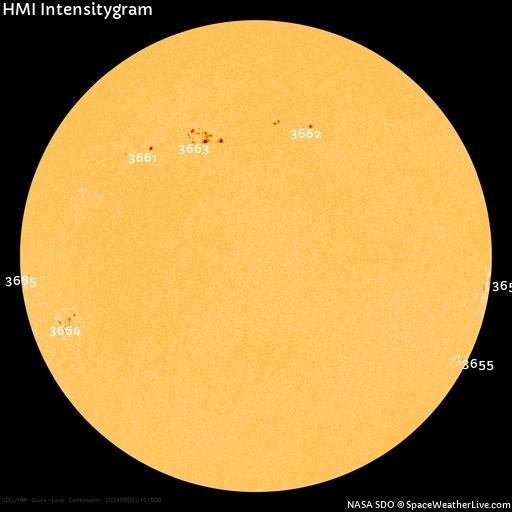
Six numbered spot groups now today visible (& 5 [since] yesterday), for the first time in this cycle ...

" Solar wind
speed: 420.7 km/sec
density: 4.9 protons/cm3
more data: ACE, DSCOVR
Updated: Today at 0945 UT
spacer.gif
X-ray Solar Flares
6-hr max: B2 0515 UT Jul22
24-hr: C1 2005 UT Jul21
explanation | more data
Updated: Today at: 0950 UT
spacer.gif
gray_gradient_line.jpg

spacer.gif
Daily Sun: 22 Jul 21
hmi200.gif

Expand: labels | no labels

spacer.gif
spacer.gif
For the first time in many years, there are 6 numbered sunspot groups on the face of the sun. Credit: SDO/HMI "

And minutes ago (local max for density ...) ... :
"Solar wind
speed: 425.9 km/sec
density: 6.3 protons/cm3
more data: ACE, DSCOVR
Updated: Today at 1050 UT "

And 6min later:
"Solar wind
speed: 427.3 km/sec
density: 5.1 protons/cm3
more data: ACE, DSCOVR
Updated: Today at 1056 UT "

Before rocketting higher, showing now clearly a RISING TENDENCY AGAIN (& decreasing [overall] density):
"Solar wind
speed: 443.1 km/sec
density: 3.2 protons/cm3
more data: ACE, DSCOVR
Updated: Today at 1100 UT "

And local max:
" Solar wind
speed: 451.1 km/sec
density: 3.5 protons/cm3
more data: ACE, DSCOVR
Updated: Today at 1105 UT
spacer.gif
X-ray Solar Flares
6-hr max: B2 0515 UT Jul22
24-hr: C1 2005 UT Jul21
explanation | more data
Updated: Today at: 1110 UT "

(Then following dropped again lower, oscillating ... ... [with local min reached ~ 422.3 ..., and another rising wave of values after that ...])

Problems again with communications ... (and expected more)
[MW band relatively ok for now, but SW bands already under strong interference ... etc. ...] [Minutes later, MW band is totally hit too ... (~ In the lapse of the max of speed above ... ...)]

Further news (cf. earlier posts, i.e. yesterday ...):
"GEOMAGNETIC STORM WATCH: A filament of magnetism near sunspot AR2846 erupted on July 20th, sparking a B-class solar flare and hurling https://spaceweather.com/images2021/20jul21/sideways_cme_anim.gif into space. Normally, the location of the blast site would rule out an impact on Earth. However, the explosion's debris squirted out sideways. New modeling by NOAA suggests that the edge of the cloud will strike Earth's magnetic field on July 23rd or 24th, sparking G1-class geomagnetic storms."
 
Last edited:
Astronomy news on Phys.org
  • #152
Extra News from spaceweather.com (still July 22):
"A CRACK IN EARTH'S MAGNETIC FIELD: During the early hours of July 22nd (0330 - 1000 UT) a crackopened in Earth's magnetic field:data. Solar wind poured in, fueling a period of geomagnetic unrest (Kp=4). So far no reports of auroras have been received, probably due to the glare of northern summer sunlight. Quiet conditions have since resumed."Update: e.g.
"Solar wind
speed: 430.0 km/sec
density: 3.4 protons/cm3
more data: ACE, DSCOVR
Updated: Today at 1842 UT
spacer.gif
X-ray Solar Flares
6-hr max: B4 1316 UT Jul22
24-hr: C1 2005 UT Jul21
explanation | more data
Updated: Today at: 1850 UT "

Communications relatively clear at this time etc. ... ...

Later, clear dropping tendency and overall drop ... (local min[?]) :
" Solar wind
speed: 414.0 km/sec
density: 2.8 protons/cm3
more data: ACE, DSCOVR
Updated: Today at 2243 UT "

Clear communications tonight ...

And ~1(-)hr later, before closing:
"Solar wind
speed: 416.7 km/sec
density: 3.9 protons/cm3
more data: ACE, DSCOVR
Updated: Today at 2321 UT "
(dropping again, oscillating ...)

and local min for speed:
" Solar wind
speed: 411.5 km/sec
density: 3.6 protons/cm3
more data: ACE, DSCOVR
Updated: Today at 2325 UT "
 
Last edited:
  • #153
July 23:
The dropping tendency and major drop in speed (still low densities) confirmed. Dropped for the first time (?) in many days below 400 ... in the early July 23rd hours ... etc. :

" Solar wind
speed: 399.4 km/sec
density: 3.7 protons/cm3
more data: ACE, DSCOVR
Updated: Today at 0203 UT
spacer.gif
X-ray Solar Flares
6-hr max: B4 0206 UT Jul23
24-hr: C1 2005 UT Jul21
explanation | more data
Updated: Today at: 0210 UT "

And hours later:

" Solar wind
speed: 381.7 km/sec
density: 2.8 protons/cm3
more data: ACE, DSCOVR
Updated: Today at 0809 UT "
(dropping oscillating ...)

+ local min just now:
" Solar wind
speed: 380.4 km/sec
density: 2.8 protons/cm3
more data: ACE, DSCOVR
Updated: Today at 0812 UT
spacer.gif
X-ray Solar Flares
6-hr max: B4 1316 UT Jul22
24-hr: B4 1316 UT Jul22
explanation | more data
Updated: Today at: 0820 UT
spacer.gif
gray_gradient_line.jpg

spacer.gif
Daily Sun: 23 Jul 21
hmi200.gif

Expand: labels | no labels

spacer.gif
spacer.gif
For the first time in many years, there are 6 numbered sunspot groups on the face of the sun. Credit: SDO/HMI"

No problems in communications as of now ... (for now ...) [and prior, since the last blackout etc. ... - see earlier posts etc. ...]

And/But News ... :

"CHANCE OF MINOR STORMS TODAY: Later today, a CME might sideswipe Earth's magnetic field. NOAA forecasters say the glancing blow could spark minor G1-classgeomagnetic storms. High-latitude sky watchers should be alert for auroras mixed with bright moonlight on July 23-24."

+ while setting up this post, exceeding (on the oscillation) 400 again just now ... (and still temporarilly rising ...):
" Solar wind
speed: 408.3 km/sec
density: 4.0 protons/cm3
more data: ACE, DSCOVR
Updated: Today at 0825 UT
spacer.gif
X-ray Solar Flares
6-hr max: B3 0228 UT Jul23
24-hr: B4 1316 UT Jul22
explanation | more data
Updated: Today at: 0830 UT "

And local max (before dropping again, temporarily, oscillating ...) just now, before closing this live update ... :
" Solar wind
speed: 411.4 km/sec
density: 4.0 protons/cm3
more data: ACE, DSCOVR
Updated: Today at 0829 UT
spacer.gif
X-ray Solar Flares
6-hr max: B3 0235 UT Jul23
24-hr: B4 1316 UT Jul22
explanation | more data
Updated: Today at: 0835 UT "

P.S.
Interference on SW bands detected, getting to MW band too right now (at least in my location) ... [with this new rise perhaps above 400 ...]

But/and, in the above oscillating, it just dropped again now below 400 ... (local min ...) :
" Solar wind
speed: 391.5 km/sec
density: 3.1 protons/cm3
more data: ACE, DSCOVR
Updated: Today at 0855 UT
spacer.gif
X-ray Solar Flares
6-hr max: B4 1316 UT Jul22
24-hr: C1 2005 UT Jul21
explanation | more data
Updated: Today at: 0900 UT "

However, [perhaps due to lapse/delay in the wind measuring/arriving ...] STILL PROBLEMS with AM communications [mainly SW and MW ... for now], right now [0915 UT] ... ...P.S.': About an hour later [or perhaps less], communications ~ restored (window in communications ...) ...

Still some dropping tendency on the overall oscillating behaviour ... (Other than that, similar behaviour and almost same [order of magnitude or approximate(ly)] levels [for speed and density] ... ...)
E.g. :
" Solar wind
speed: 390.4 km/sec
density: 3.2 protons/cm3
more data: ACE, DSCOVR
Updated: Today at 1042 UT "However, starting with low MW bands [and/or possibly LW (which I didn't check at this point) ...] (and rising gradually towards [all] SW bands ... – i.e. inverse than before ...), a NEW RADIO INTERFERENCE started around about 11:10 to 11:15 UT, and definitely confirmed at 11:20 UT (at least in my location ...), ... AND still continues going on until now at 12:15 UT (just before closing) ... etc. [extended now to (all) the said bands above etc. ...] ... ...

Data (e.g.):
" Solar wind
speed: 411.0 km/sec
density: 4.0 protons/cm3
more data: ACE, DSCOVR
Updated: Today at 1155 UT "
(~Local max, with prior local min 404.7 at 1143 UT ... – so perhaps a new rising tendency ... – we'll see ... ...)

Explanation: it is still relatively fast (relatively high speed, and although low proton density) and for some reason magnetized solar wind ... to be causing such problems in communications etc. for some days now ... (due to the consecutive [at least 3 days in a row in the past - see older posts ... etc.] halo CMEs perhaps, most likely, [and getting here after ~3days each, one after the other ... etc.] ... ...).
[But] The new storm isn't here yet! ...
[If it comes at all! ...] ...Just before final close, new dropping and dropping tendency etc. to an even lower ~ [local] min seen today and the last few days ... etc. :
" Solar wind
speed: 383.8 km/sec
density: 2.3 protons/cm3
more data: ACE, DSCOVR
Updated: Today at 1220 UT
spacer.gif
X-ray Solar Flares
6-hr max: B4 1004 UT Jul23
24-hr: B4 1316 UT Jul22
explanation | more data
Updated: Today at: 1225 UT "

And later, before final closing, NEW DROPPING AND NEW LOCAL (and [perhaps] overall, locally so far, ...) MINIMA :
1.
"Solar wind
speed: 380.2 km/sec
density: 3.1 protons/cm3
more data: ACE, DSCOVR
Updated: Today at 1244 UT "

2.
" Solar wind
speed: 374.6 km/sec
density: 2.7 protons/cm3
more data: ACE, DSCOVR
Updated: Today at 1248 UT
spacer.gif
X-ray Solar Flares
6-hr max: B4 1004 UT Jul23
24-hr: B4 1316 UT Jul22
explanation | more data
Updated: Today at: 1255 UT "

I saw temporarily MW [or SW (?) ... I don't surely recall which one of the two ...] bands being restored ... etc. (extended to all) [window ...] ... but now worse again (starting at 12:50 UT and even before closing at 1300 UT ! ... [Why?! ...] ...) ... ...
 
Last edited:
  • #154
July 23rd presented also almost all day problems [on and off] with communications etc. due to the relatively fast magnetized wind (most likely from the backdated consecutive days halo CMEs passing through Earth etc. ... ...). All this up to ~2300+ UT . By midnight UT, and starting July 24, Radio was back to normal, on a relatively quiet night, aside the C4 [long duration] flare at 0033 UT (see ahead) that also caused a temporary radio blackout (below 20HZ) for a few minutes ...
The overall dropping speed tendency continued. It stayed at ~380± mark levels for some time and by morning the Solar Wind RETURNED back to average normal conditions ...
E.g. :

" Solar wind
speed: 245.7 km/sec
density: 0.2 protons/cm3
more data: ACE, DSCOVR
Updated: Today at 0545 UT
spacer.gif
X-ray Solar Flares
6-hr max: C4 0033 UT Jul24
24-hr: C4 0033 UT Jul24
explanation | more data
Updated: Today at: 0550 UT"

+ ~ 242.5 ... at 0640 UT,

+
" Solar wind
speed: 244.9 km/sec
density: 0.3 protons/cm3
more data: ACE, DSCOVR
Updated: Today at 0649 UT
spacer.gif
X-ray Solar Flares
6-hr max: C2 0054 UT Jul24
24-hr: C4 0033 UT Jul24
explanation | more data
Updated: Today at: 0655 UT
"

And just now:
" Solar wind
speed: 245.1 km/sec
density: 0.2 protons/cm3
more data: ACE, DSCOVR
Updated: Today at 0654 UT "

Thus seems relatively stable for now ...
And no interference in Radio communications etc. at this point ...

Still the same 6 spots on sight (with 2 of them though right on west limb, to be gone very very soon ... [almost gone over limb already ...]).

& News from spaceweather.com :

1.
"WAITING FOR THE CME: A CME expected to sideswipe Earth's magnetic field on July 23rd did not arrive on time. It might have missed, or it may yet deliver a glancing blow on July 24th. There is a slight chance of G1-class geomagnetic storms in response to a tardy arrival."

2.
" LONG DURATION SOLAR FLARE:Today began with an explosion on the sun. Minutes after UT midnight, sunspot AR2849 erupted, producing a long-duration C4-class flare. NASA's Solar Dynamics Observatory recorded the ultraviolet flash:

c4_teal_anim_strip_opt.gif

An hour-long pulse of X-rays and ultraviolet radiation ionized the top of Earth's atmosphere, disrupting the usual propagation of radio waves over the Pacific Ocean. Mariners, aviators, and ham radio operators may have noticed sudden drops in signal strength at frequencies below 20 MHz: blackout map.

The explosion also hurled a CME into space: movie. The cloud does not appear to be heading for Earth. "

+ SUDDEN RISE in speed just now (from comperable to previously ~245.7±... levels to ~360... ...) [and local max, as after that it started gradually dropping ... (and at the same time starting a new overall rising perhaps oscillation ... ... We'll see ...)] :

" Solar wind
speed: 360.0 km/sec
density: 3.4 protons/cm3
more data: ACE, DSCOVR
Updated: Today at 0801 UT
spacer.gif
X-ray Solar Flares
6-hr max: C1 0206 UT Jul24
24-hr: C4 0033 UT Jul24
explanation | more data
Updated: Today at: 0805 UT
spacer.gif
gray_gradient_line.jpg

spacer.gif
Daily Sun: 24 Jul 21
hmi200.gif

Expand: labels | no labels

spacer.gif
spacer.gif
Sunspot AR2849 just unleashed a C4-class flare and CME. Credit: SDO/HMI "

It could be that the sudden rise was because of (due to) the arriving CME ... (we'll see).

Minor radio interference detected mainly on SW bands, up to less minor in the MW band, at present, as of now at this point ...
 
Last edited:
  • #155
Similar behaviour continued yesterday (July 24) [speed above 300 to ~360 etc. and minor radio interference, on & off ...] and even until now July 25. It seems the CME either missed or was that minor (+ see below).

" Solar wind
speed: 359.5 km/sec
density: 3.9 protons/cm3
more data: ACE, DSCOVR
Updated: Today at 0855 UT
spacer.gif
X-ray Solar Flares
6-hr max: B2 0457 UT Jul25
24-hr: B3 0902 UT Jul24
explanation | more data
Updated: Today at: 0900 UT
spacer.gif
gray_gradient_line.jpg

spacer.gif
Daily Sun: 25 Jul 21
hmi200.gif

Expand: labels | no labels

spacer.gif
spacer.gif
These sunspots have simple, stable magnetic fields that pose little threat for strong solar flares. Credit: SDO/HMI "News from spaceweather.com :

1. " ALL QUIET ALERT: A CME expected to hit Earth on July 23rd or 24th has missed. Our planet's magnetic field is quiet and should remain so until July 28th when a new stream of solar wind arrives. The gaseous material is flowing from a sinuous hole in the sun's atmosphere. "

2.
"ACTIVE STARSCAPE:
July 2021 has been a good month for solar activity. Solar Cycle 25 crossed multiple thresholds, including its first X-flareand 6 active regions on the solar disk. The last time so many sunspots were seen at the same time wasSept. 6, 2017. One farside CME was so strong it affected Earth despite being on the wrong side of the sun.

Against this backdrop of activity, on Friday "the sun sat still long enough for me to take its portrait," reports Alan Friedman of Buffalo, New York. Click on this image to see the entire active starscape:

Alan-Friedman-rose_sun_072321_1627165074_strip.jpg

"There were multiple active regions, prominences and a long, undulating filament of hydrogen plasma," says Friedman. "Lots to enjoy!"
"
 
Last edited:
  • #156
July 26 (and forth):

Similar conditions as yesterday maintained until now and it should be that way until about ~July 28 ... (Cf. previous post)

[Almost] All quiet (and expected [the same in the next couple of days etc. ...]) and a nice break & window [to ~ everything ...] ...

Typical ave. example (of data):

" Solar wind
speed: 326.6 km/sec
density: 4.1 protons/cm3
more data: ACE, DSCOVR
Updated: Today at 1000 UT
spacer.gif
X-ray Solar Flares
6-hr max: B1 0818 UT Jul26
24-hr: B2 2349 UT Jul25
explanation | more data
Updated: Today at: 1005 UT
spacer.gif
gray_gradient_line.jpg

spacer.gif
Daily Sun: 26 Jul 21
hmi200.gif

Expand: labels | no labels

spacer.gif
spacer.gif
These sunspots have simple, stable magnetic fields that pose little threat for strong solar flares. Credit: SDO/HMI "
 
  • #157
Small look/update later on July 26:

" Solar wind
speed: 306.0 km/sec
density: 7.3 protons/cm3
more data: ACE, DSCOVR
Updated: Today at 1645 UT
spacer.gif
X-ray Solar Flares
6-hr max: B2 1609 UT Jul26
24-hr: B2 1609 UT Jul26
explanation | more data
Updated: Today at: 1650 UT "[However, no significant drastic changes – goes still as announced/predicted ... etc.]
(+ The oscillating [up and down, with a regular range] and overal [max & min etc.] varying of the Solar Wind, as well as proton velocities ranging bet. ~ 200-350 Km/sec, and proton densities [relatively low now, these days, below average normal ...] similar to levels seen around these days etc. ..., are in fact NORMAL Solar/Earth/Space Weather average expected Phenomena and Values/data ... ...)P.S.
+ small rise in density (~ local max) now ... (however, still normal[/within normal limits] though) :
"Solar wind
speed: 307.9 km/sec
density: 9.5 protons/cm3
more data: ACE, DSCOVR
Updated: Today at 1744 UT "
 
Last edited:
  • #158
Part A (Suppl. for July 26 & briefing for July 27):

After the previous post density was seen rising [more] significantly [at the end of the day] at times (~same levels of speed), e.g. as follows:
July 26
" Solar wind
speed: 322.5 km/sec
density: 13.6 protons/cm3
more data: ACE, DSCOVR
Updated: Today at 2345 UT "

And more density rising [at times] on July 27 (otherwise similar behaviour) ..., e.g. as follows:
" Solar wind
speed: 328.6 km/sec
density: 26.9 protons/cm3
more data: ACE, DSCOVR
Updated: Today at 2345 UT
spacer.gif
X-ray Solar Flares
6-hr max: B9 2226 UT Jul27
24-hr: B9 2226 UT Jul27
explanation | more data
Updated: Today at: 2350 UT "

Communications quiet (as far as I know) both days ... ...Part B (July 28):

Obviously the CME is here. E.g. take a look at these data:

" Solar wind
speed: 451.4 km/sec
density: 9.2 protons/cm3
more data: ACE, DSCOVR
Updated: Today at 1044 UT
spacer.gif
X-ray Solar Flares
6-hr max: B6 0738 UT Jul28
24-hr: B9 2226 UT Jul27
explanation | more data
Updated: Today at: 1050 UT "

And speed & density rising further too (local [and perhaps overall so far] max just now):

" Solar wind
speed: 490.6 km/sec
density: 15.4 protons/cm3
more data: ACE, DSCOVR
Updated: Today at 1050 UT "

(then temporarilly slightly dropping, oscillating ...)

AND just exceeded 500 just now:

" Solar wind
speed: 500.5 km/sec
density: 12.2 protons/cm3
more data: ACE, DSCOVR
Updated: Today at 1100 UT "

Communications are not affected right now, but they were/did earlier.
Speed reached 400 Km/sec at 0455 UT.

News from spaceweather.com :
" THE SOLAR WIND HAS ARRIVED:Earth is entering a stream of solar wind flowing ~400 km/s from a sinuous hole in the sun's atmosphere. First contact during the early hours of July 28th opened a crack in Earth's magnetic field, sparking an hours-long episode of minor (Kp=4) geomagnetic unrest. So far, no auroras have been reported. "Update a few hours later (new rise and local max[?] for speed) :

" Solar wind
speed: 539.3 km/sec
density: 8.4 protons/cm3
more data: ACE, DSCOVR
Updated: Today at 1445 UT
spacer.gif
X-ray Solar Flares
6-hr max: B2 1400 UT Jul28
24-hr: B9 2226 UT Jul27
explanation | more data
Updated: Today at: 1450 UT
spacer.gif
gray_gradient_line.jpg

spacer.gif
Daily Sun: 28 Jul 21
hmi200.gif

Expand: labels | no labels

spacer.gif
spacer.gif
These decaying sunspots pose little threat for strong solar flares. Credit: SDO/HMI "

Communications still relatively ok though (just minor interference at this point ...).
 
Last edited:
  • #159
Auroras reported overnight (early morning hours on July 28):

" RARE BLUE AURORAS OVER CANADA: Earth is inside a stream of solar wind flowing from a sinuous hole in the sun's atmosphere. First contact during the early hours of July 28th sparked rare blue auroras over Canada. Joel Weatherly sends this picture of the colorful spray just outside Edmonton:

blueauroras_strip.jpg

"Despite light pollution, clouds, and bright moonlight, the auroras put on a spectacular show," says Weatherly. "Note the blue on top!"

Auroras are almost always green, and sometimes red or purple. Blue, however, is rare. Weatherly can thank the Moon for its appearance.

Blue is a sign of bright moonlight hitting the top of the auroras. The process is called "resonant scattering." High up in the aurora zone, ionized nitrogen molecules (N2+) naturally produce blue light, just a little; the geomagnetic glow is usually too faint to see. But when these ions get hit by moonlight, they capture and re-emit blue photons from the Moon. Voilà!--extra blue.

Take some nitrogen, add solar wind, mix with moonlight. That's the recipe for aurora blues. "

Increased daylight in high northern latitudes makes auroras generally rarer and hard to detect and see especially this time of the year (day started getting smaller a bit though) ...
 
  • Like
Likes jasonRF and Astronuc
  • #160
INFO FROM SIDC - RWC BELGIUM 2021 Jul 28 12:34UTC

The solar activity has been quiet over the past 24 hours, with the X-ray
flux below C-level. The two sunspot groups (Catania sunspot group 22 / NOAA
AR-2846, and Catania sunspot group 23 / NOAA AR-2847) have produced few
B-class flares. A new bipolar sunspot groups (Catania sunspot group 24) has
emerged close to the central meridian at altitude -04 degrees and did not
produce any significant flare. The solar activity is expected to remain at
low levels over the next 24 hours with a small chances of C-class flare.

A large coronal dimming was observed on July 28 from 08:03 UTC to 09:33 UTC
in the north-west quadrant (near latitude 34 degrees and longitude 13
degrees). Further investigation on this event will be provided as data
comes in. The true speed of the coronal mass ejection observed in
SOHO/LASCO-C2 coronagraphe images on July 27 at 03:24 UTC with a projected
speed of 388 km/s has been re-evaluated to about 600 km/s with a new
arrival time estimated on July 30 mid days. Only minor to no effect is
expected on the solar wind conditions and geomagnetic activity.
http://www.sidc.be/
https://wwwbis.sidc.be/silso/dayssnplot
 
  • Like
Likes Stavros Kiri
  • #161
Thanks @Astronuc for the excellent source and update ...

July 29 (similar solar wind conditions - no spots now ... etc.)

" Solar wind
speed: 540.6 km/sec
density: 7.0 protons/cm3
more data: ACE, DSCOVR
Updated: Today at 0840 UT
spacer.gif
X-ray Solar Flares
6-hr max: A6 0702 UT Jul29
24-hr: B2 1400 UT Jul28
explanation | more data
Updated: Today at: 0845 UT
spacer.gif
gray_gradient_line.jpg

spacer.gif
Daily Sun: 29 Jul 21
hmi200.gif

Expand: labels | no labels

spacer.gif
spacer.gif
The sun is blank--no sunspots. Credit: SDO/HMI "

That was local max for speed (regular to low density) a few minutes ago. [Then dopping oscillating up and down ... etc.]
Highest overall max seen these days (i.e. ~global max [upper extremum] for this wind due to this CME) was 570 Km/sec at 03:44 UT.

Communications still relatively ok at this point.

News (from spaceweather.com):

"A CME IS ABOUT TO MISS EARTH (BARELY): Yesterday, July 28th (0700 UT), a magnetic filament in the sun's northern hemisphere erupted. The resulting CME is going to pass by Earth on Aug. 1st, barely missing our planet. NOAA analysts are still studying the eruption; there's a chance the forecast will change from "near miss" to "glancing blow," so stay tuned."
 
Last edited:
  • #162
CMEs seems to have [almost] missed Earth ... (for now)

Now, Aug. 2, 2021 (update):

[Relative speed drop (since yesterday etc.) with kind of significant density increase at the same time ... + new spot group (after 5 spotless days) seems to be forming ... : ]

" Solar wind
speed: 385.4 km/sec
density: 22.8 protons/cm3
more data: ACE, DSCOVR
Updated: Today at 1520 UT
spacer.gif
X-ray Solar Flares
6-hr max: A6 1521 UT Aug02
24-hr: A6 2327 UT Aug01
explanation | more data
Updated: Today at: 1525 UT
spacer.gif
gray_gradient_line.jpg

spacer.gif
Daily Sun: 02 Aug 21
hmi200.gif

Expand: labels | no labels

spacer.gif
spacer.gif
A new sunspot is growing at the circled location. Credit: SDO/HMI "
(+ see: https://spaceweather.com/images2021/02aug21/latest_4096_HMIBC_crop.jpg)New un-numbered (as of yet) high southern latitude spot group arising, after 5 spotless days in a row ...
We'll see how it develops ...

P.S. + yes, just confirmed that the new group developped enough to receive a number, AR2850 ...

P.S.' (latest editing):
News from spaceweather.com:
"DENSE SOLAR WIND: A dense wave of solar wind just crashed, gently, against Earth's magnetic field. This could be the ripple from a passing CME--one of several that left the sun in late July expected to miss Earth by a short distance. High-latitude photographers should be alert for auroras in night-sky exposures on Aug. 2-3."
 
Last edited:
  • #163
On July 3rd conditions returned back to normal ...

Today July 7th a CIR is in progress (due to CMEs differential arrivals ...) and relatively unstable geomagnetic conditions perhaps expected ...

1st in a row spotless day.

Max speed seen so far today (on an overall rising since yesterday) was 426 Km/sec at 1110 UT [i.e. a few minutes ago ...], and relatively increased to high densities today (max 30.12 protons/cm3 at 0445 UT earlier this morning), both oscillating & varying ...

Latest edit: new or returning spot group just seen perhaps appearing or forming on upper east limb ... (no official number yet)
 
Last edited:
  • #164
[Correction Note: on previous post above meant Aug. 3rd & Aug. 7th ... not July ...]

The Sun is being becoming again very interesting the last few days, especially after ~ Aug. 24th.

The day before yesterday (today is Aug. 28, 2021) :
SOLAR TSUNAMI AND CME: An explosion on the sun on July 26 produced a massive "solar tsunami" and a CME apparently heading for Earth. The eruption was accompanied by a loud clap of radio static, which roared from the loudspeakers of shortwave radios in North America."SOLAR TSUNAMI AND CME: Sunspot AR2859 erupted on Aug. 26th, producing a C3-class solar flare:movie. The flare, however, was not the main attraction. The eruption also caused a massive "solar tsunami." Watch the shadowy wave ripple across the sun in this false-color ultraviolet movie from NASA's Solar Dynamics Observatory:

tsunami_strip.gif

The expanding circular shadow is a wave of hot plasma and magnetism. Based on the time it took to reach the next sunspot, halfway around the sun, the tsunami was traveling faster than 110,000 mph.

Solar tsumanis always herald a CME, and this one was no exception. Soon after the tsunami broke, SOHO coronagraphs detected a CME:movie. The storm cloud appears to be heading for Earth, albeit somewhat off center. NOAA analysts are looking at the CME now, using computer models to determine its arrival time. Our guess: Aug. 30th. Stay tuned."Current Conditions:
" Solar wind
speed: 363.2 km/sec
density: 5.3 protons/cm3
more data: ACE, DSCOVR
Updated: Today at 2110 UT
spacer.gif
X-ray Solar Flares
6-hr max: C1 1643 UT Aug28
24-hr: M4 0611 UT Aug28
explanation | more data
Updated: Today at: 2115 UT
spacer.gif
gray_gradient_line.jpg

spacer.gif
Daily Sun: 28 Aug 21
hmi200.gif

Expand: labels | no labels

spacer.gif
spacer.gif
Sunspots AR2859 and AR2860 are bothcrackling with C-class solar flares. Credit: SDO/HMI "

AR2860 is huge, complex and very "promising", perhaps even for X-class flares ... :

"MAJOR FLARE WARNING: Sunspot AR2860 is big, angry, and it's directly facing Earth. The active region just unleashed a significant M4.7-classsolar flare (Aug. 28 @ 0611 UT), probably hurling a CME toward Earth:movie. If current trends continue, a major X-flare could be in the offing, so stay tuned."
 
Last edited:
  • Informative
Likes sophiecentaur
  • #165
"AURORAS LOVE SEPTEMBER: September is one of the best months of the year for auroras. NASA says so. At this time of year, even minor gusts of solar wind can spark an Arctic light show. Why? Two reasons: (1) Increasing autumn darkness and (2) the Russell-McPherron effect. This sets the stage for possible high-latitude auroras on Sept. 5-6 when a stream of solar wind is expected to reach Earth."

Sept. 5 & 6 :
Highly increased Sunspot activity started on Sept. 5 (up to six groups on appeared sight) and the remaining 4 increased significantly in size further today Sept. 6 ...
Also, Geomagnetic Unrest (not storms though) and possible Auroras are expected today (etc.) ...
https://www.spaceweather.com/archive.php?view=1&day=05&month=09&year=2021
https://www.spaceweather.com/archive.php?view=1&day=06&month=09&year=2021

Current conditions:
"
Solar wind
speed: 314.8 km/sec
density: 7.5 protons/cm3
more data: ACE, DSCOVR
Updated: Today at 0940 UT
spacer.gif
X-ray Solar Flares
6-hr max: B6 0815 UT Sep06
24-hr: B7 1811 UT Sep05
explanation | more data
Updated: Today at: 0945 UT
spacer.gif
gray_gradient_line.jpg

spacer.gif
Daily Sun: 06 Sep 21
hmi200.gif

Expand: labels | no labels

spacer.gif

spacer.gif
Sunspots AR2864, AR2866 and AR2868 have all grown in the past 24 hours, but remain mostly quiet. Credit: SDO/HMI
"
 
Last edited:
  • #166
A) "A gust of solar wind hit Earth's magnetic field on Sept. 7th. The sharp uptick in solar wind speed ... ... it made this happen:


unexpected.jpg


"At 2.30 a.m. on Sept. 8th, I woke up and had a look outside," says photographer Thomas Kast of Oulu, Finland. "Wowsers, nearly the whole sky was full of auroras! Got the camera and ran onto the front yard. This is a photo from the back of my camera, when a strong green band rose quickly and brightened the night sky."


... ... Meanwhile, auroras have been reported over Scotland, too. "B) Huge Earth-facing Sunspot groups [large enough to "swallow planets ..." (and even visible with naked eye [with protection of course! - CAUTION ...] ...)] with increased chance of strong Earth-directed solar flare activity (for the next few days or so etc. ...) and [at the same time] increased solar wind, even today Sept. 8, 2021 ... :

" Solar wind
speed: 412.9 km/sec
density: 6.6 protons/cm3
more data: ACE, DSCOVR
Updated: Today at 0955 UT
spacer.gif
X-ray Solar Flares
6-hr max: B4 0429 UT Sep08
24-hr: C2 0009 UT Sep08
explanation | more data
Updated: Today at: 1000 UT
spacer.gif
gray_gradient_line.jpg

spacer.gif
Daily Sun: 08 Sep 21
hmi200.gif

Expand: labels | no labels

spacer.gif

spacer.gif
Sunspot AR2864 produced a C2-class solar flare and, possibly, a CME on Sept. 8th. Credit: SDO/HMI "

C) "EARTH-DIRECTED SOLAR FLARE: Today began with an explosion on the sun. Just after UT midnight on Sept. 8th, sunspot AR2864 unleashed a C2-class solar flare: movie. A pulse of UV radiation ionized Earth's atmosphere, briefly disturbing shortwave radio propagation around the Pacific Rim: map. The explosion might have hurled a CME into space; confirmation is pending fresh data from SOHO."D) Overall local max speed of solar wind seen [so far, today] was 440 Km/sec at 10:17 UT, 10:28 UT and 11:10 UT (a few minutes ago) ... . Earlier (before that) local speed max was 424 at 09:06 UT ... ; and overall local min 374 at 11:40 UT ..., (and, a few minutes ago, 377 at 11:54 UT [and overall dropping ...], while just now new overall local min of 366 at 12:17 UT ...) ... (etc.). [And] For proton density overall local max these days was 30.12 protons/cm3 yesterday Sept. 7 at 14:09 UT ; today Sept. 8, local max of 29.60 at 08:12 UT but [otherwise] generally low to normal proton density so far ... (etc.).E) Caution for communications and internet these days; Auroras likely too ...
 
Last edited:
  • Informative
Likes sophiecentaur
  • #167
1) cool picture (posted on spaceweather.com)


sunspotsunset_anim.gif


2) Also yesterday


alaska_strip.jpg


(... photographer Ayumi Bakken of Fairbanks, Alaska. "After 1:30 a.m., it shifted to huge pulsating auroras all over the sky, that was so amazing.")
3) And an extra C8 flare and radio blackout yesterday Sept. 8 at 17:36 UT ... (and CMEs coming up pending to reach Earth ...)4) 5 visible numberd spot groups today Sept. 9
"Solar wind
speed: 346.6 km/sec
density: 6.6 protons/cm3
more data: ACE, DSCOVR
Updated: Today at 1654 UT
spacer.gif
X-ray Solar Flares
6-hr max: B3 1210 UT Sep09
24-hr: C8 1730 UT Sep08
explanation | more data
Updated: Today at: 1700 UT
spacer.gif
gray_gradient_line.jpg

spacer.gif
Daily Sun: 09 Sep 21
hmi200.gif

Expand: labels | no labels

spacer.gif

spacer.gif
Sunspots AR2864, AR2866 and AR2868 are all crackling with C-class solar flares. Credit: SDO/HMI
"
 
Last edited:
  • #168
EARTH-DIRECTED SOLAR FLARE AND HALO CME: The morning of Oct. 9, an explosion on the sun hurled a CME almost directly toward Earth. It's called a "halo CME" because the storm cloud appears to make a halo around the solar disk as it moves in our direction. Minor to moderately-strong geomagnetic storms are possible when the CME arrives during the late hours of Oct. 11th or Oct 12th.Note: it came from an M1.6 Solar Flare (Oct. 9).

Today (Oct. 10) ... an estimate from spaceweather.com:
"GEOMAGNETIC STORM WARNING: NOAA forecasters have modeled the trajectory of yesterday's CME and confirmed that it will likely arrive on Oct. 11th. The impact could spark G1 to G2-class geomagnetic storms. If a moderately-strong G2-storm materializes, sky watchers in the United States could see auroras as far south as a line connecting New York to Oregon."

+ today's Sun:
hmi200.gif

Expand: labels | no labels

spacer.gif
spacer.gif
Sunspot AR2882 has a 'beta-gamma' magnetic field that harbors energy forM-class solar flares. Credit: SDO/HMI
 
Last edited:
  • #169
AURORAS IN THE USA: Last night, a coronal mass ejection (CME) struck Earth's magnetic field, sparking a moderately strong geomagnetic storm. Auroras were sighted in the USA as far south as Nebraska with lights so bright in some places that onlookers successfully photographed them using cell phones.

See also spaceweather.com (today's edition) ... + for photos etc.
 
  • #170
[The date (for long time range Almanac reasons ...) on the previous post (forgot to mention it explicitly within the post) was October 12, 2021 ... (e.g. when using the spaceweather.com "Time Machine" ... [to e.g. see the pictures/photos of the auroras etc. ... etc.]). ]

Today (Now): Th. October 21, 2021 (~2130 – 2330 UT ± ...)
Current (and previous ~ 7 days) brief report:

1. Currently Significantly high Solar winds (over 500km/sec), and since (significant rise above 400km/sec) late hours of Oct 19 and (~above 500km/sec) [since] Early Hours of Oct 20 ... :

" Solar wind
speed: 520.4 km/sec
density: 6.7 protons/cm3
more data: ACE, DSCOVR
Updated: Today at 2235 UT
spacer.gif
X-ray Solar Flares
6-hr max: B4 2213 UT Oct21
24-hr: B8 1515 UT Oct21
explanation | more data
Updated: Today at: 2240 UT
spacer.gif
gray_gradient_line.jpg

spacer.gif
Daily Sun: 21 Oct 21
hmi200.gif

Expand: labels | no labels

spacer.gif
spacer.gif
Sunspot AR2886 has a simple magnetic field that poses little threat for strong solar flares. Credit: SDO/HMI "

(Local max of speed too [~520+ km/sec] around this time ..., & just a bit earlier ~ 2145 UT reached ~528 - 530 [km/sec] local max ..., while the overall global max (over 7 days period) was ~ 550 km/sec at ~ 0120 UT on Oct 20, 2021 ...)
[While before or on October 19 and earlier (within 7 days from today) the Solar Wind Speed was mainly moderate but still relatively high (or a bit above average, so to speak) and between 300-400 km/sec ...]

~ moderate [proton] densities ~all this time ...

2. Radio Blackouts (on and off) and/or Radio interference [strong at times] (mainly for/on MW & SW bands) due to the high speed solar winds especially yesterday & today ..., and ~ 2145 UT today [until about ~2210 UT] there was a land-line internet disruption (at least in my location and for my internet carrier/company) ... which I doubt it was just coincidental ! ... ... (Mobile internet was mostly fine, I think, as far as I know [at that time] ...)

Auroras are expected too since yesterday etc. ... (CME arrival etc. - see 4. ahead)

3. [Today's Solar Almanac] Extreme Space Weather and Severe Solar Storm exactly 20 years ago (Oct 21, 2001 with ~max of Solar Cycle #23) [no severe power or internet disruptions though back them but only many interesting auroras even in lower latitudes ...] (happened due to CMEs ejected after 2 giant almost identical ~ X1.6 + ... strong Solar Flares, when the CMEs arrived Earth after a couple of days or so ... - the phenomenon lasted for over a day&1/2 etc. ...) ...:

("SEVERE SPACE WEATHER: 20 years ago today, two CMEs hit Earth's magnetic field. The rapid double blow sparked a severe geomagnetic storm with auroras so bright they were visible in some US states before nightfall. Power grids, satellite networks and the internet survived the event, which lasted for more than 36 hours.")
Paolo-Bardelli-03_1634750384_strip.jpg

Above: Red auroras over Tradate, Italy (latitude +45N), on Oct. 21, 2001. Photo credit: Cesare Guaita​

This is what the sun looked like that day:

ar9661_lab_crop.png
4. Explanation of 1., 2. ... :
On Oct 17, ~02:33UT etc., a large corona hole sends solar wind, as announced & posted by spaceweather.com the following day (Oct 18):
"SOLAR WIND, INCOMING: A large southern hole in the sun's atmosphere is spewing solar wind toward Earth. ETA: Oct. 19-20. Solar wind speeds could top 500 km/s, sparking auroras around the Arctic Circle."
That explains everything.

5. New Sunspot Group (Active Region [that will probably get the number AR2887]) forming on the Sun's SouthEastern Limb [and is responsible for (relatively significant but not yet Earth-directed) B-class Solar Flares]:
"ACTIVITY ON THE SUN'S EASTERN LIMB: A new sunspot group is emerging over the sun's southeastern limb, right here. It is crackling with activity. An intensifying series of minor B-class solar flares is probably stronger than it looks because each explosion has been partially eclipsed by the edge of the sun"6. After ~midnight UT (~00:00UT, starting the new day/date, Oct. 22, 2021) solar wind speeds started droping below 500km/sec, with an overall dropping trend (tendency) [but still oscillating up&down a bit], showing finally (after 2 whole days) that the phenomenon is subsiding and the CME is finally passing, heading away from Earth ...

~Local min (for speed) at the time/table below:

" Solar wind
speed: 469.0 km/sec
density: 4.4 protons/cm3
more data: ACE, DSCOVR
Updated: Today at 0240 UT
spacer.gif
X-ray Solar Flares
6-hr max: B4 2213 UT Oct21
24-hr: B8 1515 UT Oct21
explanation | more data
Updated: Today at: 0245 UT "

... and still overall dropping (oscillating) ...
 
Last edited:
  • #171
[Supplement to previous post etc. + on the new day (today), Oct. 22, 2021 .../+ follow-up post etc. ...] [Additions and corrections etc. ... regarding the (~above ~8 day period, the past days until today, Fri. Oct. 22, 2021 ...) brief report of [the] relatively Interesting (to very interesting and somewhat Unusual etc.) Solar Behaviour and Activity [during that time ...] ...]:1. This was posted on spaceweather.com on Oct. 16:
"CO-ROTATING INTERACTION REGION: Geomagnetic unrest is possible on Oct. 18-19 when a co-rotating interaction region (CIR) is expected to hit Earth's magnetic field. CIRs are transition zones between fast- and slow-moving streams of solar wind. Sharp, shock-like density gradients and enhanced magnetic fields in CIRs often do a good job sparking Arctic auroras."

2. Oct. 17 picture of events etc. & posts: ...
...

3. Oct 18 picture of events etc. & posts ... : ...
...

4. Oct 19 brief review: ...
...

5. Corrections on previous post: a) ... b) ... c)
...

6. Today Fri. Oct. 22 :
... + latest picture and ~forecast etc. :
... Overall or ~global local max for speed (at the neighbourhood near the starting of the new day [Oct 22] and a bit earlier etc.): ~526-527 Km/sec at 22:37UT last night, ... and then started droppining significantly ..., and [at] ~00:00UT got below or equal to 500... (and as a precursor even a bit earlier before that/then [after ~2300UT ± ...] it also hit those lower values ... ~460... ± ...) ... and then dropped after that to as low as 437Km/sec at 08:08UT this morning (local and overall min ...). After that started rising and showing explicit rising tendency AGAIN, reaching as high as 500 or a bit over at times etc. [one mainly time in particular ... 501 at 12:29UT ...], with an oscillating however behaviour (up & down, and overall slowly rising etc., perhaps most of the time, for now etc. ...) ..., even until now or recently ... ... : (e.g.)

" Solar wind
speed: 478.4 km/sec
density: 5.5 protons/cm3
more data: ACE, DSCOVR
Updated: Today at 1201 UT
spacer.gif
X-ray Solar Flares
6-hr max: B5 1105 UT Oct22
24-hr: B8 1515 UT Oct21
explanation | more data
Updated: Today at: 1205 UT
spacer.gif
gray_gradient_line.jpg

spacer.gif
Daily Sun: 22 Oct 21
hmi200.gif

Expand: labels | no labels

spacer.gif
spacer.gif
A new and potentially active sunspot group is emerging at the circled location. Credit: SDO/HMI "
{~ local min for speed ...}
[+ ~ same picture before that, at 11:45UT ... (478.2 ..., 6.3 ...)]And subsequently:
" Solar wind
speed: 483.7 km/sec
density: 5.8 protons/cm3
more data: ACE, DSCOVR
Updated: Today at 1205 UT
spacer.gif
X-ray Solar Flares
6-hr max: B5 1105 UT Oct22
24-hr: B8 1515 UT Oct21
explanation | more data
Updated: Today at: 1210 UT "
{Local max for speed}

And exactly the same picture/numbers/values as above [11min later] at 12:16 UT (for speed & density), while in between (12:10 UT) speed dropped just a bit (at ~481... or ~482... ± ... etc.) ... etc. (minor oscillations ...).

+ e.g. local overall min for around this time ... :
" Solar wind
speed: 477.0 km/sec
density: 7.1 protons/cm3
more data: ACE, DSCOVR
Updated: Today at 1235 UT
spacer.gif
X-ray Solar Flares
6-hr max: B5 1105 UT Oct22
24-hr: B8 1515 UT Oct21
explanation | more data
Updated: Today at: 1240 UT "

... Then rose again above 480... even close or/and expected to get higher ... ~500... more or less ± again ... ... etc.
(So it looks like another wave ... [of Solar Wind ...] etc.)
... ... etc.

...

However, later look just before closing this Live Watch ..., SURPRISE significant DROP! :
" Solar wind
speed: 445.5 km/sec
density: 4.8 protons/cm3
more data: ACE, DSCOVR
Updated: Today at 1321 UT
spacer.gif
X-ray Solar Flares
6-hr max: B5 1105 UT Oct22
24-hr: B8 1515 UT Oct21
explanation | more data
Updated: Today at: 1325 UT "

(Winding down again?! ... ...)

Or rather it looks like a major end dive? ... : (~local min ... [?])
" speed: 434.4 km/sec
density: 4.2 protons/cm3
more data: ACE, DSCOVR
Updated: Today at 1327 UT
spacer.gif
X-ray Solar Flares
6-hr max: B5 1105 UT Oct22
24-hr: B8 1515 UT Oct21
explanation | more data
Updated: Today at: 1330 UT "

And 429Km/sec (overall global local min for now) seen at 13:23UT ..., 437 at 13:33UT ..., and then started rising a bit again with max 468 (local max), for now, seen at ~13:39UT ... ... ...

Even higher at 13:46UT (~478... again etc. ...) ... ... etc.
["Solar wind
speed: 478.3 km/sec
density: 4.1 protons/cm3
more data: ACE, DSCOVR
Updated: Today at 1346 UT"]And now (final) ... Guess what!? [Another major end-signifying drop down to regular normal average values ... with density rising at the same time ...] :
" Solar wind
speed: 358.5 km/sec
density: 13.2 protons/cm3
more data: ACE, DSCOVR
Updated: Today at 1407 UT
spacer.gif
X-ray Solar Flares
6-hr max: B5 1105 UT Oct22
24-hr: B8 1515 UT Oct21
explanation | more data
Updated: Today at: 1410 UT ".

Also (overall global & local min) of ~348...± seen at ~14:03UT ...

This (although temporary - due to still oscillating up&down etc. [even after that reached again ~ 500...± - see below etc.] ...) was either signifying [of] the almost end of the phenomenon etc., that will eventually ~stabilize (with less and minor still oscillations and fluctuations eventually etc. ...) etc. ..., OR it is indeed temporary, and it's not over yet (may not - though I doubt it - it did it before [though] etc.) ..., or a new one may be starting etc. (?) [any (&other) ideas etc.? ...] ... ... (I will research/look into that later ..., both by Almanac announcements and past, present or future events etc. and by futher perhaps Live Watch(es) ... later (and in the future ahead) ... [if (deemed) significant or necessary ... etc.] ...) .

Last set of measurements/data:
" Solar wind
speed: 495.5 km/sec
density: 4.9 protons/cm3
more data: ACE, DSCOVR
Updated: Today at 1436 UT
spacer.gif
X-ray Solar Flares
6-hr max: B5 1105 UT Oct22
24-hr: B8 1515 UT Oct21
explanation | more data
Updated: Today at: 1440 UT "

[And it even went up to almost exactly 500Km/sec (±) (local and ~ overall for around now etc. Max, for now etc. ...) JUST a bit after that ... (or [a bit] before, or perhaps both ...) ! ... . ] [added later: I actually did confirm/(I verified) a 503 ... at 14:37UT ... (and there was another neighbouring a bit less one just before or right at 14:36 or 14:35 ...). ]

End of Live watch (for now and/or for today etc.).

2.-5. in the next post ...
 
Last edited:
  • #172
Some items still pending from previous post (probably for later).

In the meantime, today Thu Oct. 28, 2021:

SIGNIFICANT X-CLASS SOLAR FLARE: There was a global eruption on the sun today. It started with a powerful X1-class solar flare from sunspot AR2887. The blast created a massive tsunami of plasma in the sun's atmosphere, which rippled across the entire solar disk. A CME is probably heading for Earth, raising the possibility of a geomagnetic storm on Halloween.

And from spaceweather.com :
" Solar wind
speed: 294.1 km/sec
density: 14.4 protons/cm3
more data: ACE, DSCOVR
Updated: Today at 2345 UT
spacer.gif
X-ray Solar Flares
6-hr max: C3 1953 UT Oct28
24-hr: X1 1535 UT Oct28
explanation | more data
Updated: Today at: 2350 UT
spacer.gif
gray_gradient_line.jpg

spacer.gif
Daily Sun: 28 Oct 21
hmi200.gif

Expand: labels | no labels

spacer.gif
spacer.gif
Sunspot AR2887 has a 'beta-gamma' magnetic field that harbors energy for strong M-class solar flares. Any eruptions today will be geoeffective because the sunspot is directly facing Earth. Credit: SDO/HMI "

&

" MAJOR X-CLASS SOLAR FLARE: Earth orbiting satellites have just detected an X1-class solar flare from Earth-facing sunspot AR2887. The blast at 1535 UT on Oct. 28th created a massive tsunami of plasma in the sun's atmosphere:

tsunami_gold_crop_strip_opt.gif

The blast also hurled a CME into space. Coronagraph images are not yet available, but evidence for a CME is already pursuasive. The USAF reports strong Type II and Type IV radio emissions generated by a CME plowing through the sun's atmosphere. In addition, energetic particles accelerated at the leading edge of a CME have already reached Earth.

When will the CME itself arrive? Assuming that it is Earth directed, probably on Oct. 30th or 31st. Fresh data from SOHO coronagraphs will allow a more precise forecast, so stay tuned.

During the flare, a pulse of X-rays and extreme UV radiation ionized the top of Earth's atmosphere, causing a strong shortwave radio blackout centered on South America:

blackout_x1_strip.jpg

Aviators, mariners, and ham radio operators on the daylit side of Earth may have noticed strange propagation effects at frequencies below 30 MHz.

Sunspot AR2887 may not be finished yet. It has already produced two M-class flares and an X-flare today. The active region is directly facing Earth, so any additional eruptions should be geoeffective. "

&

" CME UPDATE: First-look images of today's CME are arriving from SOHO now.Take a look. The bulk of the CME appears to be flying south of the sun-Earth line. However, there's still a good chance of an Earth-directed component. Stay tuned as more data become available."
 
  • Informative
Likes sophiecentaur
  • #173
A) For Fri Oct 29, 2021

1) spaceweather.com announcement + forecast comments etc.:
"GEOMAGNETIC STORM WATCH: A strong G3-class geomagnetic storm is possible on Oct. 30th when the CME from yesterday's X1-flare is expected to hit Earth's magnetic field. Such storms can spark naked-eye auroras as far south as Illinois and Oregon (typically 50° geomagnetic latitude) and photographic auroras at even lower latitudes. Lesser G1 and G2-class storms could persist through Halloween as Earth passes through the CME's wake."
(from spaceweather.com Oct. 29, 2021 edition)

This storm will probably be a bit stronger than other times (for this cycle so far).
Even internet [and perhaps telephone lines etc. - not power grid though probably at this point] etc. (besides radio communications etc.) may be at risk this weekend [and up until Mon or Tue etc., perhaps - depending on time of arrival of the CME etc. ...] (low to minor risk).
[These, however, so far, are regular (medium to mild), expected and routine Solar Phenomena for this new current (perhaps a bit overperforming) Solar Cycle # 25 (currently at max, peaking around ~2024-25) ... ...
Things might get worse though, as the cycle moves on ...
So caution is needed and advised ...]
#solar #sun #spaceweather #solarstorm #earth #radio #communications #halloween #weekend #risk #new #internet #warning

[Note: on Th Oct 21 (after midnight - i.e. early am hours of Fri 22nd, in my location) there was a brief internet failure [at least in my location and for my hard line carrier (mobile network I think was probably fine)] perhaps due to the fast passing [strong] solar wind (see earlier posts) that peaked at a max around that time (~21:45 UT) (and noticed the failure between ~21:45 or 21:50 – 22:10 or 22:15 UT ...) ...]2) Ending of Oct 29 picture of data and Almanac:
" Solar wind
speed: 315.1 km/sec
density: 7.8 protons/cm3
more data: ACE, DSCOVR
Updated: Today at 2345 UT
spacer.gif
X-ray Solar Flares
6-hr max: B9 2209 UT Oct29
24-hr: M1 0242 UT Oct29
explanation | more data
Updated: Today at: 2350 UT
spacer.gif
gray_gradient_line.jpg

spacer.gif
Daily Sun: 29 Oct 21
hmi200.gif

Expand: labels | no labels

spacer.gif
spacer.gif
Sunspot AR2887 has a 'beta-gamma' magnetic field that harbors energy for strong M-class and X-class solar flares. Any eruptions today will be geoeffective because the sunspot is almost directly facing Earth. Credit: SDO/HMI "

Note also that there are 5 numbered active spot groups on the Sun at this point (or 6 max, if AR2887 is/may be actually two groups and not just one ... [see earlier dates]); and also AR2891 is significant and relatively big too ...3) Other/more:

" THE CORONAL MASS EJECTION: Here it comes. A coronal mass ejection (CME) launched on Oct. 28th by an X1-class solar flare is heading almost directly for Earth. SOHO coronagraphs recorded the CME racing away from the sun faster than 1457 km/s (3.3 million mph):

cme_c3_crop_opt.gif

The movie is full of "snow"--speckles caused by solar protons striking the coronagraph's CCD camera. These particles were accelerated toward the spacecraft (and toward Earth) by shock waves in the leading edge of the CME. Traveling at relativistic speeds, the protons reached us in less than an hour. The CME itself will take more than two days to cross the sun-Earth divide. ETA: Oct. 30th or 31st."

&

"SOLAR RADIO BURST: Who says explosions in space make no sound? The X1-class solar flare on Oct. 28th created a loud burst of static in shortwave radio receivers on Earth. Click to hear what emerged from Thomas Ashcraft's loudspeaker in rural New Mexico:


"I captured the X1 flare on my spectrograph and audio recorders," says Ashcraft. "It was super dynamic. It is not often to see a solar radio event showing up in purple range on my radio telescope."

Astronomers classify solar radio bursts into 5 types. Ashcraft recorded a mixture of Type II and Type V. These are caused, respectively, by shock waves and electron beams moving through the sun's atmosphere in the aftermath of strong flares. "B) Today, Sat. Oct 30, 2021:

1) Announcement update:
"GEOMAGNETIC STORM WARNING: NOAA forecasters say there is an 85% chance of geomagnetic storms on Oct. 30th when a CME (described below) is expected to hit Earth's magnetic field. It could be a strong storm, category G3, which means auroras could descend to mid-latitudes--places like Kansas, Nebraska, Oregon, Virginia. The CME's arrival time is uncertain; estimates range from midday on Oct. 30th to the early hours of Oct. 31st."2) Current data watch etc.:

" Solar wind
speed: 315.6 km/sec
density: 14.0 protons/cm3
more data: ACE, DSCOVR
Updated: Today at 0750 UT
spacer.gif
X-ray Solar Flares
6-hr max: C3 0315 UT Oct30
24-hr: C3 0315 UT Oct30
explanation | more data
Updated: Today at: 0755 UT
spacer.gif
gray_gradient_line.jpg

spacer.gif
Daily Sun: 30 Oct 21
hmi200.gif

Expand: labels | no labels

spacer.gif
spacer.gif
Sunspot AR2887 has a 'beta-gamma' magnetic field that harbors energy for strong M-class and X-class solar flares. Credit: SDO/HMI "

&

" Solar wind
speed: 316.5 km/sec
density: 12.3 protons/cm3
more data: ACE, DSCOVR
Updated: Today at 0755 UT
spacer.gif
X-ray Solar Flares
6-hr max: C3 0315 UT Oct30
24-hr: C3 0315 UT Oct30
explanation | more data
Updated: Today at: 0800 UT "
Note: only 4 spot groups are left/(remaining) today [one gone ...]
(max 5 ... if ... cf. above ...)...
 
Last edited:
  • Like
Likes sophiecentaur
  • #174
Stavros Kiri said:
The movie is full of "snow"--speckles caused by solar protons striking the coronagraph's CCD camera.
That's brilliant.
 
  • Like
Likes Stavros Kiri
  • #175
Follow up post/watch (Oct 30, 2021):

Values seem to be rising (rising trend? ... we'll see):

" Solar wind
speed: 318.8 km/sec
density: 22.4 protons/cm3
more data: ACE, DSCOVR
Updated: Today at 1304 UT
spacer.gif
X-ray Solar Flares
6-hr max: C1 0953 UT Oct30
24-hr: C3 0315 UT Oct30
explanation | more data
Updated: Today at: 1310 UT
spacer.gif
gray_gradient_line.jpg

spacer.gif
Daily Sun: 30 Oct 21
hmi200.gif

Expand: labels | no labels

spacer.gif
spacer.gif
Sunspot AR2887 has a 'beta-gamma' magnetic field that harbors energy for strong M-class and X-class solar flares. Credit: SDO/HMI "

And

" Solar wind
speed: 319.7 km/sec
density: 24.0 protons/cm3
more data: ACE, DSCOVR
Updated: Today at 1311 UT
spacer.gif
X-ray Solar Flares
6-hr max: C1 0953 UT Oct30
24-hr: C3 0315 UT Oct30
explanation | more data
Updated: Today at: 1315 UT "
 
  • #176
A) Still for Oct 30, 2021:
Yes, finally it was a slowly rising tendency (both for speed and proton density) that continued all day yesterday (today is Oct 31), with speed exceeding 350Km/sec, even exceeded 400Km/sec etc. ..., and continued [rising tendency etc.] even until today, with a max (around the time when the CME arrived - after all it was a weak impact - see ahead) of 458Km/sec at ~11:30UT ...
However, it seems that the initial rising tendency [see previous post yesterday etc.] (and especially the rising in the proton density, accompanied with smooth slowly rising of speed etc.) etc. may have been due to a different phenomenon and not due to the arrival of the CME yet at that point (see ahead) ...

These are from yesterday:

E.g.
" Solar wind
speed: 387.3 km/sec
density: 5.7 protons/cm3
more data: ACE, DSCOVR
Updated: Today at 2319 UT
spacer.gif
X-ray Solar Flares
6-hr max: C1 2129 UT Oct30
24-hr: C3 0315 UT Oct30
explanation | more data
Updated: Today at: 2350 UT
spacer.gif
gray_gradient_line.jpg

spacer.gif
Daily Sun: 30 Oct 21
hmi200.gif

Expand: labels | no labels

spacer.gif
spacer.gif
Sunspot AR2887 has a 'beta-gamma' magnetic field that harbors energy for strong M-class and X-class solar flares. Credit: SDO/HMI "

" GEOMAGNETIC STORM UPDATE: We're still waiting for the CME. Right now minor geomagnetic unrest is happening at Arctic latitudes. This is due to a crack that opened in Earth's magnetic field--a phenomenon unrelated to the incoming CME. So far the much-anticipated storm has not yet begun. Subscribers to ourSpace Weather Alert Service will receive a text message when the CME strikes.

MODELLING THE CORONAL MASS EJECTION--UPDATED: NOAA forecasters have a sophisticated computer program called "WSA-ENLIL," which models the propagation of CMEs through interplanetary space. Here is the latest model for the CME now approaching Earth:

enlil_model_crop_strip2_opt.gif

If these images confuse you, here is a labeled frame to help make sense of it.

The computer model predicts that the CME will make first contact with our planet around 1800 UT on Oct. 30th. That time has already passed, so the CME must be moving more slowly than forecasters thought. A slower moving-CME could deliver a weaker blow, and thus a less intense storm.

The model also predicts a sharp increase in solar wind speed (800 km/s) and a 5-fold jump in solar wind density in the CME's wake. Such conditions, if they materialize, could still fuel a potent storm despite the CME's tardy arrival.

Our revised forecast calls for G2 or G3 conditions during the early hours of Oct. 31st. Happy Halloween! "B) Today Oct 31, 2021:

1) [from spaceweather.com]
" WEAK CME IMPACT: A CME hit Earth's magnetic field on Oct. 31st at approximately 10:00 UT. The impact was weak--a far cry from the "big hit" we expected. What happened? It's possible that the bulk of the Oct. 28th CME missed our planet; after all, it was directed somewhat south of the sun-Earth line. Despite the feebleness of the impact, minor G1-class geomagnetic storms are still possible in the hours ahead. (...)

AURORAS OVER ICELAND: Last night (Oct. 30th) on the south coast of Iceland, Christopher Mathews was waiting for the CME to arrive when, suddenly, the sky filled with auroras:

iceland_strip.jpg

"The rock formation just offshore is all that remains of an extinct volcano eroded by North Atlantic waves," says Mathews, who took the picture from the Reykjanes Peninsula.

Spoiler alert: This was not the big CME everyone was waiting for. Instead, Mathews may have observed the near-miss of a different CME, a minor cloud which left the sun on Oct. 26th. It was expected to pass close to Earth on Oct. 30th--and apparently it did. A ripple in the solar wind from the nearby CME disturbed Earth's magnetic field, sparking auroras over Iceland and Scandinavia. "

2) Latest watch:

E.g.
" Solar wind
speed: 428.4 km/sec
density: 12.4 protons/cm3
more data: ACE, DSCOVR
Updated: Today at 1457 UT
spacer.gif
X-ray Solar Flares
6-hr max: B4 0923 UT Oct31
24-hr: C3 1529 UT Oct30
explanation | more data
Updated: Today at: 1500 UT
spacer.gif
gray_gradient_line.jpg

spacer.gif
Daily Sun: 31 Oct 21
hmi200.gif

Expand: labels | no labels

spacer.gif
spacer.gif
A new and active sunspot is emerging at the circled location. Credit: SDO/HMI "

And

" Solar wind
speed: 434.5 km/sec
density: 12.3 protons/cm3
more data: ACE, DSCOVR
Updated: Today at 1506 UT

X-ray Solar Flares
6-hr max: B4 0923 UT Oct31
24-hr: C3 1529 UT Oct30
explanation | more data
Updated: Today at: 1510 UT "

...

" Solar wind
speed: 433.6 km/sec
density: 12.0 protons/cm3
more data: ACE, DSCOVR
Updated: Today at 1545 UT

X-ray Solar Flares
6-hr max: B4 0955 UT Oct31
24-hr: C3 0706 UT Oct31
explanation | more data
Updated: Today at: 1550 UT "

And just before closing:

" Solar wind
speed: 423.0 km/sec
density: 11.9 protons/cm3
more data: ACE, DSCOVR
Updated: Today at 1616 UT

X-ray Solar Flares
6-hr max: B6 1615 UT Oct31
24-hr: C3 0706 UT Oct31
explanation | more data
Updated: Today at: 1620 UT "

And

" Solar wind
speed: 420.7 km/sec
density: 11.5 protons/cm3
more data: ACE, DSCOVR
Updated: Today at 1620 UT
...

X-ray Solar Flares
6-hr max: B6 1615 UT Oct31
24-hr: C3 0706 UT Oct31
explanation | more data
Updated: Today at: 1625 UT "

...

[Showing a perhaps dropping tendency at this point, as if the main part of storms or of the phenomenon is passing ... (we'll see) ]
[Radio interference, perhaps mainly low to mild, was seen with above earlier speeds etc. ...]

P.S.
1) And a later look:
" Solar wind
speed: 412.6 km/sec
density: 9.3 protons/cm3
more data: ACE, DSCOVR
Updated: Today at 2030 UT

X-ray Solar Flares
6-hr max: C3 2000 UT Oct31
24-hr: C3 2000 UT Oct31
explanation | more data
Updated: Today at: 2035 UT "

And

" Solar wind
speed: 405.9 km/sec
density: 7.7 protons/cm3
more data: ACE, DSCOVR
Updated: Today at 2046 UT

X-ray Solar Flares
6-hr max: C3 2000 UT Oct31
24-hr: C3 2000 UT Oct31
explanation | more data
Updated: Today at: 2050 UT "

+ rising again (!?) ... (or temporary? ...) :
" Solar wind
speed: 435.0 km/sec
density: 8.9 protons/cm3
more data: ACE, DSCOVR
Updated: Today at 2056 UT

X-ray Solar Flares
6-hr max: C3 2000 UT Oct31
24-hr: C3 2000 UT Oct31
explanation | more data
Updated: Today at: 2100 UT "

...

2) Latest description from spaceweather.com (and kind of apologetic ...):
" WEAK CME IMPACT AND GEOMAGNETIC STORM: A CME hit Earth's magnetic field on Oct. 31st at ~10:00 UT. The impact was weak--a far cry from the "big hit" we expected--and it sparked an equally weak G1-class geomagnetic storm.

In Alberta, Canada, photographer Harlan Thomas stayed up all night waiting for the predicted strong geomagnetic storm. Instead, he caught this lesser display just before sunrise over icy Dewitt Pond:

Alberta_strip.jpg

"It was a short-lived event," says Thomas. "The auroras were active and battled the twilight until about 45 minutes before the sun came up."

In summary, the Halloween Storm of 2021 was more trick than treat. What happened? It's possible that the bulk of the Oct. 28th CME simply missed our planet. The source of the CME, sunspot AR2887, is located in the sun's southern hemisphere. When it exploded 3 days ago, much of the debris flew south of the sun-Earth line. Computer models suggesting a direct hit apparently gave too little weight to the CME's assymetry.

Hey, it happens! Space weather forecasting is a probabilistic activity beset by the unknowns of storms that get started 93 million miles away from Earth and glide for days invisibly through the near vacuum of interplanetary space before they spring upon us with little warning. May be next time... "
 
Last edited:
  • #177
An interesting follow up post about the previous event etc. (and Oct 31 & Nov 1) will be posted later. In the meantime:

Tue Nov. 2, 2021

A)
" GEOMAGNETIC STORM WATCH: Minor G1-class geomagnetic storms are possible on Nov. 4th when a CME is expected to sideswipe Earth's magnetic field. The CME was hurled into space on Nov. 1st by an M1-class solar flare from departing sunspot AR2887. We're not certain yet, but another CME may be following close behind it. Read on...

YET ANOTHER SOLAR FLARE AND CME: Sunspot AR2891 is directly facing Earth--and it just exploded. An M1-class solar flare rocked the sunspot's magnetic canopy on Nov. 2nd. It was slow flare, starting at 0300 UT and lasting for hours.

mflare_teal_anim_strip_opt.gif

Above: A movie of the flare at 131 Å. More wavelengths:193 Å, 171 Å, 131 Å.​

Slow solar flares do one thing very well: Produce CMEs. This one hurled a CME directly toward Earth. Newly-arriving data from SOHO coronagraphs show a halo CME due to arrive on Nov. 5th.

X-rays and extreme ultraviolet radiation from the flare ionized the top of Earth's atmosphere, causing a minor shortwave radio blackout over Australia and southeast Asia: map. Aviators, mariners and ham radio operators might have noticed unusual propagation effects at frequencies below ~25 MHz. "

B) Irrelevant other effect/phenomenon (to be explained) right now, today (started rising speed yesterday ...) ... :

" THE SOLAR WIND IS BLOWING: Earth is inside a stream of fast-moving (600 km/s) solar wind, which is causing geomagnetic unrest around the poles on Nov. 2nd. This is not a storm-level event. However, Arctic sky watchers should be alert for auroras. "

C) Update on A) etc. ...

" A HALO CME IS HEADING FOR EARTH: The sun just hurled a storm cloud toward Earth. It launched during the early hours of Nov. 2nd, propelled by an M1.7-class solar flare in the magnetic canopy of sunspot AR2891. This movie from SOHO shows the resulting CME:

halocme_anim_opt.gif

Researchers call this a "halo CME" because the storm cloud apppears to form an expanding halo all the way around the sun. It's a sign that the CME is heading directly for our planet.

Estimated time of arrival: Nov. 5th. The impact could spark geomagnetic storms as strong as category G2.

The X-factor in this forecast is the possible arrival of one or more glancing-blow CMEs beginning Nov. 4th. These were emitted by departing sunspot AR2887 near the edge of the Earth strike-zone. A series of glancing blows on Nov. 4th could set the stage for stronger than expected storms on Nov. 5th. "

D) Recent today's [~Live] Look:
After a speed global overall Max of 632-34 Km/sec a few hours ago (and a first high local max of 619Km/sec at 0700 UT, this morning – while yesterday it closed with a rising ~478Km/sec [or 468? ~ ...] ...), here is a recent picture etc., about a bit less than an hour ago ...:

" Solar wind
speed: 589.3 km/sec
density: 8.3 protons/cm3
more data: ACE, DSCOVR
Updated: Today at 1545 UT

X-ray Solar Flares
6-hr max: C1 1305 UT Nov02
24-hr: M1 0301 UT Nov02
explanation | more data
Updated: Today at: 1550 UT
spacer.gif
gray_gradient_line.jpg

spacer.gif
Daily Sun: 02 Nov 21
hmi200.gif

Expand: labels | no labels

spacer.gif
spacer.gif
Sunspot AR2891 poses a threat for Earth-directed M-class solar flares. Credit: SDO/HMI "

And a bit later (new rising again, and also, in addition to that below, local max again of ~619Km/sec at ~17:10 UT ...):

" Solar wind
speed: 616.1 km/sec
density: 9.0 protons/cm3
more data: ACE, DSCOVR
Updated: Today at 1712 UT

X-ray Solar Flares
6-hr max: C1 1305 UT Nov02
24-hr: M1 0301 UT Nov02
explanation | more data
Updated: Today at: 1715 UT "More details perhaps later.

Later look and evaluation revealed an overall global max, for solar wind speed, of 645Km/sec at 15:33 UT, for today [Tue, 2 Nov, 2021] ... (earlier today) ... – ... and estimates are that it starts dropping now, ... (for now at least) ... [19:00 UT] –

A local overall so far Min of 561Km/sec was seen at 18:41 UT ... and overall still dropping (but the wind is still oscillating, up & down ... etc.) ... for now ... [20:00 UT]

P.S. Further closer look discovered [more] ~isolated points/measurements of local minima (in this recent descend dropping region of the curve), as follows:
1) 552 Km/sec at 16:50 UT (Global regional min, earlier today, before a stable drop was obvious ... )
2) 556 ... at 18:34 UT (local overall min signifying the dropping recent segment of the curve )
3) 560 ... at 18:47 ... (Local min, beats the already posted next/cf. earlier above)
and
4) 561 ... at 18:41 (posted earlier .../see earlier above) ...

Notes: 1) It could be that this fast wind was/is still from the Halloween flare and CME ...
2) Radio communications etc., although the fast wind, seemed mostly fine today (just some Geomagnetic unrest) [except for around the live flares times interference ... etc. ... - see earlier ...].

Latest last view before final close of this ~Live Watch:
" Solar wind
speed: 573.6 km/sec
density: 8.0 protons/cm3
more data: ACE, DSCOVR
Updated: Today at 2126 UT

X-ray Solar Flares
6-hr max: B5 1633 UT Nov02
24-hr: M1 0301 UT Nov02
explanation | more data
Updated: Today at: 2130 UT "
 

Attachments

  • hmi200.gif
    hmi200.gif
    6.8 KB · Views: 150
Last edited:
  • Like
Likes sophiecentaur
  • #178
Wed, 3 Nov., 2021

" HERE COMES A CANNIBAL CME: It's official. The CME heading for Earth is a cannibal. SOHO coronagraphs recorded the CME leaving the sun on Nov. 2nd following a slow-motion solar flare (M1.7) in the magnetic canopy of sunspot AR2891:

halocme_anim_opt.gif

Cannibal CMEs are fast coronal mass ejections that sweep up slower CMEs in front of them. Piled together, the mish-mash of CMEs contain strong magnetic fields and compressed plasmas that can do a good job sparking geomagnetic storms.

The slower CMEs, in this case, were hurled into space on Nov. 1st and 2nd by departing sunspot AR2887. NOAA analysts plugged all the plasma clouds into a computer model, and this is what they found:

enlilmodel_crop_strip_opt.gif

The animation shows the cannibal cloud sweeping up one whole CME and a portion of another. If NOAA's model is correct, the combined CME will make first contact with our planet around 2300 UT on Nov. 3rd, with geomagnetic storms commencing on Nov. 4th.

The model also predicts a +300 km/s increase in solar wind speed and a 5-fold jump in solar wind density in the CME's wake. These conditions, if they materialize, would set the stage for geomagnetic storms as strong as category G2. "

(More later - see below √)

E.g. (for today's picture - wind speed has in fact indeed dropped today, but still remains on the relatively [medium to] high scale ... [and almost similar levels all day so far ... (with expected oscillations etc. ...)]):
" Solar wind
speed: 523.9 km/sec
density: 6.9 protons/cm3
more data: ACE, DSCOVR
Updated: Today at 0940 UT
spacer.gif
X-ray Solar Flares
6-hr max: B4 0830 UT Nov03
24-hr: C1 1305 UT Nov02
explanation | more data
Updated: Today at: 0945 UT
spacer.gif
gray_gradient_line.jpg

spacer.gif
Daily Sun: 03 Nov 21
hmi200.gif

Expand: labels | no labels

spacer.gif
spacer.gif
Sunspot AR2891 poses a threat for M-class solar flares. Credit: SDO/HMI "

And

" GEOMAGNETIC STORM WATCH: Updated forecast models from NOAA suggest that a cannibal CME (described below) will hit Earth's magnetic field on Nov. 4th around 0600 UT. The impact could spark a G2-class geomagnetic storm with auroras spilling out of the Arctic Circle down to latitudes as low as ~55 degrees. "
 
Last edited:
  • Like
Likes sophiecentaur
  • #179
CME impact and high solar wind again

" Solar wind
speed: 762 km/sec
density: 0.8 protons/cm3
more data: ACE, DSCOVR
Updated: Today at 2111 UT

X-ray Solar Flares
6-hr max: C3 2111 UT Nov03
24-hr: C3 2111 UT Nov03
explanation | more data
Updated: Today at: 2115 UT
spacer.gif
gray_gradient_line.jpg

spacer.gif
Daily Sun: 03 Nov 21
hmi200.gif

Expand: labels | no labels

spacer.gif
spacer.gif
Sunspot AR2891 poses a threat for M-class solar flares. Credit: SDO/HMI "

" GEOMAGNETIC STORM WATCH: Updated forecast models from NOAA suggest that a cannibal CME ... will hit Earth's magnetic field on Nov. 4th around 0600 UT. The impact could spark a G2-class geomagnetic storm with auroras spilling out of the Arctic Circle down to latitudes as low as ~55 degrees."

And

"CME IMPACT: Deep space satellites have just detected a CME minutes away from hitting Earth's magnetic field. See the data. It is not yet clear if this is the "Cannibal CME" described ... or a precursor CME that was not swept up by the cannibal cloud. G1- to G2-classgeomagnetic storms are possible in the hours ahead."

+ the latest announcements:

"CME IMPACT --> GEOMAGNETIC STORM WARNING: A cannibal CME, described below, has just hit Earth's magnetic field. Solar wind data from the DSCOVR spacecraft show a stairstep structure indicative of two or more CMEs pressed together. G1- to G2-class geomagnetic storms are possible in the hours ahead."

"CME IMPACT SPARKS STRONG GEOMAGNETIC STORM: A cannibal CME, described below, hit Earth's magnetic field on Nov. 3rd at approximately 20:00 UT. Solar wind data from the DSCOVR spacecraft show a stairstep structureindicative of two or more CMEs pressed together. A strong G3-class geomagnetic storm is underway now."Max wind speed (seen so far): 831 Km/sec at 23:09 UT (on Nov. 3rd)
 
Last edited:
  • #180
News Th Nov 4, 2021 (etc.)

" CME IMPACT SPARKS STRONG GEOMAGNETIC STORM:
A cannibal CME hit Earth's magnetic field on Nov. 3rd (~20:00 UT). The impact sparked a strong G3-class geomagnetic storm with intense auroras around the Arctic Circle. Aurora tour guide Markus Varikphotographed the outburst from Tromsø, Norway:

tromso_strip.jpg

Varik is one of the most experienced guides in Norway. "Even I was impressed," he says. "The auroras were strong, one of the best displays in years. I am very tired, but happy."

Earth is now passing through the CME's wake. Storm conditions have subsided to category G1 (minor) with occasional episodes of G2 (moderately strong). This means auroras may be visible in northern-tier US states such as Minnesota and Montana. Dark skies are essential, so get away from city lights. (...)

What is a Cannibal CME? It's a CME that eats its own kind. On Nov. 2nd, sunspot AR2891 hurled a fast CME toward Earth. As it approached our planet, it overtook at least one other CME and swallowed it. The mashed-up pair struck Earth on Nov. 3rd (2000 UT). Solar wind data from the DSCOVR spacecraft showed a stairstep structure indicative of two or more CMEs pressed together. "

" CME BALLOON LAUNCH: Within minutes of the CME's arrival, the students of Earth to Sky Calculus and Spaceweather.com launched a cosmic ray balloon to the stratosphere. Ten years of practice helps get a balloon in the air quickly:

cmelaunch_strip.jpg

We will launch a follow-up balloon after the geomagnetic storm subsides--all part of our decade-long monitoring program to see how solar activity affects atmospheric radiation. And, yes, that *is* a Tardis hitching a ride on the payload. If it survives the storm, it will be sold in the ... (...) . "
 
  • Like
Likes sophiecentaur and collinsmark
  • #181
A)
" Recent Large Solar Flare Creates Results: Aurora Borealis, from the October 30/31, 2021 geomagnetic storm/solar flare, is captured by astronaut Thomas Pesquet (ESA) aboard the ISS (International Space Station) --- NASA Photo

  • beta&t=YrXnL-c2i9d0OPOOw3I7E9HvIuom4R32pZhjcJ_sIss.jpg

"
(See https://www.linkedin.com/feed/update/activity:6862237729711886336)

B) [from spaceweather.com]

" THE STORM IS OVER: Earth's magnetic field is calming as our planet exits the wake of a Cannibal CME, which struck on Nov. 3rd. Almost 20 hours of strong geomagnetic storms followed the CME's impact. During the apex of the category G3 event, auroras were sighted as far south as California, New Mexico and Colorado. The storm is over now. (...)

CANNIBAL CME SPARKS LOW LATITUDE AURORAS: Auroras in California? Believe it. On Nov. 4th, the glow of a strong (G3) geomagnetic storm spread almost to Los Angeles. Aurora chaser Hongming Zheng took this picture just outside Lincoln CA at latitude +39N:

lincoln_strip.jpg

"This was my southernmost aurora sighting yet!" says Zheng. "A red glow and occasional pillars were visible to the naked eye. I was very pleasantly surprised with this unexpectedly strong geomagnetic storm."

More reds appeared in Joshua Tree, California (+34N). "I could not see them with my naked eye," says veteran observer Don Davis, "but my camera recorded these rare SoCal auroras."

The CME that sparked the display was a special "Cannibal CME"--that is, a mashup of multiple solar storm clouds striking Earth all at once. Cannibal CMEs contain tangled magnetic fields and compressed plasmas that often do a good job sparking auroras.

In Abisko, Sweden, the auroras were so bright they could be seen at sunrise:

abisko_strip.jpg

"I almost slept through the storm," confesses photographer Oliver Wright. "I woke up just after 5am and I could see auroras through my bedroom window. So quick coffee and headed down to the bridge over the Abisko canyon. I was watching purple auroras getting washed out by the nautical sunrise. I've only ever seen that once before during the Saint Patrick Day geomagnetic storm of 2015."

more aurora images: from Marianne Bergli of Tromsø, Norway; from Marybeth Kiczenski of Bayfield, Wisconsin; from Markus Varik of Tromsø, Norway; from Chris Cook of Cape Cod, Massachusetts; from Greg Ash of Duluth Minnesota; from Genevieve of Greenwood, Maine; from Thomas Spence of Tofte, Minnnesota; from Shelley Johnson of Anacortes, Washington "

C) This one (e.g. from the collection above) is I think amazing and spectacular:
"
776dcc9b-2512-2fbc-c754-bc9c222001dd.jpg
Above: Auroras over Bayfield, Wisconsin, on Nov. 4, 2021. " Oh wow - what a show! Never thought I'd see such vivid color and SO MUCH RED!" says photographer Marybeth Kiczenski.
"

D) Current conditions today Fri., Nov. 5, 2021:

" Solar wind
speed: 557.4 km/sec
density: 8.1 protons/cm3
more data: ACE, DSCOVR
Updated: Today at 1020 UT

X-ray Solar Flares
6-hr max: B4 0850 UT Nov05
24-hr: C3 1053 UT Nov04
explanation | more data
Updated: Today at: 1025 UT
spacer.gif
gray_gradient_line.jpg

spacer.gif
Daily Sun: 05 Nov 21
hmi200.gif

Expand: labels | no labels

spacer.gif
spacer.gif
Sunspot AR2891 has a 'delta-class' magnetic field that harbors energy for M-class solar flares. Credit: SDO/HMI "

Note: Speed of course has dropped significantly (from a max of over 800Km/sec - see earlier posts), but still the solar wind speed is in the medium to high scale ...
(No significant interference or problems in communications at this point, currently).
 
Last edited:
  • #182
A) ~ 1 Week Review:

1) Nov. 8, 2021
"INCOMING SOLAR WIND STREAM: A minor stream of solar wind is approaching Earth, and it could cause polar geomagnetic unrest when it arrives on Nov. 8th or 9th. The gaseous material is flowing from an equatorial hole in the sun's atmosphere. Auroras could appear around the Arctic Circle as the planetary K-index reaches a value of 3 or 4."

2) Nov

B)
Nov. 15, 2021
"A DENSE STREAM OF SOLAR WIND: Unexpectedly, Earth is entering a slow-moving but dense stream of solar wind on Nov. 15th. Relatively strong magnetic fields in the stream are opening a crack in Earth's magnetosphere, setting the stage for possible Arctic auroras."

Today Tue Nov. 16, 2021
" CO-ROTATING INTERACTION REGION SPARKS AURORAS: A co-rotating interaction region (CIR) hit Earth's magnetic field during the late hours of Nov. 15th: data. "Suddenly, the whole sky exploded with colorful auroras," reports Markus Varik from Tromsø, Norway:

corona_strip.jpg

"We were surprised by this display because the forecast called for low geomagnetic activity," he says.

Indeed, forecasters were surprised. CIRs are notoriously hard to predict, and this one was not expected to arrive for another 24 hours--if it existed at all.

CIRs are transition zones between slow- and fast-moving streams of solar wind. Inside a CIR, solar wind plasma is compressed, sometimes even forming magnetized shock-like structures. They strike with the effect of a mini-CME.

Earth is now inside a fast-moving stream of solar wind following behind the CIR. With wind speeds topping 600 km/s, the Arctic aurora show could continue through Nov. 16th. Stay tuned! "

Picture now:
"Solar wind
speed: 605.5 km/sec
density: 8.8 protons/cm3
more data: ACE, DSCOVR
Updated: Today at 0904 UT

X-ray Solar Flares
6-hr max: B2 0748 UT Nov16
24-hr: B2 1005 UT Nov15
explanation | more data
Updated: Today at: 0910 UT

gray_gradient_line.jpg

spacer.gif
Daily Sun: 16 Nov 21
hmi200.gif

Expand: labels | no labels

spacer.gif
spacer.gif
A new sunspot is emerging at the circled location. Credit: SDO/HMI "

Overall Global Speed Max so far 630 Km/sec at 02:25 UT ...

Problems in communications and especially srong interference in LW, MW and SW bands receptions ...
(at least in South-East Europe, even as we speak ...)
 
Last edited:
  • Like
Likes PhysicoRaj and sophiecentaur
  • #183
A) For Nov. 18

"THE NEXT SOLAR WIND STREAM: Earth is exiting one solar wind stream. Another is on the way. Flowing from a southern hole in the sun's atmosphere, the gaseous material is due to arrive on Nov 21-22. NOAA forecasters say that a corotating interaction region (CIR) traveling just ahead of the stream could spark geomagnetic activity and Arctic auroras on Nov. 20th."

" Solar wind
speed: 499.0 km/sec
density: 5.9 protons/cm3
more data: ACE, DSCOVR
Updated: Today at 2345 UT

X-ray Solar Flares
6-hr max: A3 1817 UT Nov18
24-hr: B1 1546 UT Nov18
explanation | more data
Updated: Today at: 2350 UT

gray_gradient_line.jpg

spacer.gif
Daily Sun: 18 Nov 21
hmi200.gif

Expand: labels | no labels

spacer.gif
spacer.gif
All of these sunspots have simple 'alpha-class' magnetic fields that pose no threat for strong solar flares. Credit: SDO/HMI "B) Now, Nov 19-20 ...

"Solar wind
speed: 417.8 km/sec
density: 8.1 protons/cm3
more data: ACE, DSCOVR
Updated: Today at 0206 UT

X-ray Solar Flares
6-hr max: A2 2102 UT Nov19
24-hr: A4 1906 UT Nov19
explanation | more data
Updated: Today at: 0210 UT

gray_gradient_line.jpg

spacer.gif
Daily Sun: 19 Nov 21
hmi200.gif

Expand: labels | no labels

spacer.gif
spacer.gif
These sunspots have simple 'alpha-class' magnetic fields that pose no threat for strong solar flares. Credit: SDO/HMI "C) Repeat/Reminder again (Important) (holds/posted/appeared on spacewether.com as a forecast for Nov 18-20, ... and beyond ...):

"THE NEXT SOLAR WIND STREAM: Earth is exiting one solar wind stream. Another is on the way. Flowing from a southern hole in the sun's atmosphere, the gaseous material is due to arrive on Nov 21-22. NOAA forecasters say that a corotating interaction region (CIR) traveling just ahead of the stream could spark geomagnetic activity and Arctic auroras on Nov. 20th."

So stay tuned ... It should be interesting ...
 
Last edited:
  • #184
Already [entering] in the stream ... (increased Solar Wind again, today, Saturday Nov 20, 2021)

" Solar wind
speed: 541.2 km/sec
density: 8.7 protons/cm3
more data: ACE, DSCOVR
Updated: Today at 1646 UT

X-ray Solar Flares
6-hr max: A7 1536 UT Nov20
24-hr: A7 1536 UT Nov20
explanation | more data
Updated: Today at: 1650 UT

gray_gradient_line.jpg

spacer.gif
Daily Sun: 20 Nov 21
hmi200.gif

Expand: labels | no labels

spacer.gif
spacer.gif
These two sunspots are small and quiet. Credit: SDO/HMI "

Increased geomagnetic activity may lie ahead - Auroras and/or problems in communications etc. are possible today, tonight, tomorrow and the days ahead ...

Already observed strong radio interference in SW and MW bands ...
 
Last edited:
  • #185
Nov [20 &] 21, 2021 :

" ARCTIC AURORAS STOP TRAFFIC: Last night in northern Finland, the auroras were so bright Rayann Elzein had to pull his car to the side of the road. "It was the only safe way to take pictures," he said. "The auroras were changing very fast, and we kept having to reposition our cameras on either side of the road to shoot the action!"

roadstop_strip.jpg

"After a while, the show subsided and we started driving back home... Only to have to stop again 10 minutes later when it flared up again!" he says. "A brilliant pink nitrogen fringe appeared, and the pink was very visible to the naked eye."

The display was caused by a stream of solar wind flowing from a southern hole in the sun's atmosphere. The stream reached Earth during the late hours of Nov. 20th and is currently blowing faster than 600 km/s. Arctic sky watchers, prepare to stop your cars... "

[Current Data] E.g. :
" Solar wind
speed: 614.7 km/sec
density: 8.8 protons/cm3
more data: ACE, DSCOVR
Updated: Today at 1646 UT

X-ray Solar Flares
6-hr max: B1 1235 UT Nov21
24-hr: B1 1235 UT Nov21
explanation | more data
Updated: Today at: 1650 UT

gray_gradient_line.jpg

spacer.gif
Daily Sun: 21 Nov 21
hmi200.gif

Expand: labels | no labels

These two sunspots are small and quiet. The chance of strong solar flares today is no more than 1%. Credit: SDO/HMI "

And just now (22:15 UT):
" Solar wind
speed: 606.9 km/sec
density: 7.3 protons/cm3
more data: ACE, DSCOVR
Updated: Today at 2211 UT

X-ray Solar Flares
6-hr max: A5 2117 UT Nov21
24-hr: B1 1235 UT Nov21
explanation | more data
Updated: Today at: 2215 UT "

And Geomagnetic unrest and radio blackouts in the meantime etc. ...
 
Last edited:
  • Like
  • Informative
Likes collinsmark and sophiecentaur
  • #186
Update [Nov 21&] 22, 2021 :

1.) Solar Wind Speed reached a max of 699 Km/sec at 12:19 UT yesterday on Nov 21.

2.) (posted today, Nov 22)
" SOLAR WIND SPARKS ARCTIC AURORAS: A stream of solar wind is buffeting Earth's magnetic field, blowing ~ 600 km/s. A gust last night sparked bright auroras over Tromsø, Norway.

outburst_strip.jpg

"It was an amazing outburst," says photographer Markus Varik. "We drove for more than an hour to find a break in the clouds. So totally worth it!"

The solar wind is flowing from a southern hole in the sun's atmosphere. Earth should remain inside the stream for another 12 to 24 hours. "

3.) General Geomagnetic Unrest and problems in radio communications continue today too etc.

4.) Today's data:
E.g.
1) [this morning]
" Solar wind
speed: 557.3 km/sec
density: 7.9 protons/cm3
more data: ACE, DSCOVR
Updated: Today at 1026 UT

X-ray Solar Flares
6-hr max: A1 0449 UT Nov22
24-hr: B1 1235 UT Nov21
explanation | more data
Updated: Today at: 1030 UT

gray_gradient_line.jpg

spacer.gif
Daily Sun: 22 Nov 21
hmi200.gif

Expand: labels | no labels

spacer.gif
spacer.gif
These two sunspots are small and quiet. The chance of strong solar flares today is no more than 1%. Credit: SDO/HMI "

2) [& Just a few minutes ago]
" Solar wind
speed: 535.1 km/sec
density: 7.5 protons/cm3
more data: ACE, DSCOVR
Updated: Today at 2110 UT

X-ray Solar Flares
6-hr max: A2 1826 UT Nov22
24-hr: A5 2117 UT Nov21
explanation | more data
Updated: Today at: 2115 UT "

3) [& just now before closing this live watch]
" Solar wind
speed: 542.3 km/sec
density: 7.9 protons/cm3
more data: ACE, DSCOVR
Updated: Today at 2116 UT

X-ray Solar Flares
6-hr max: A2 1826 UT Nov22
24-hr: A5 2120 UT Nov21
explanation | more data
Updated: Today at: 2120 UT "
 
Last edited:
  • #187
Nov 23, 2021

"
SURPRISE: SOME RED AURORAS ARE *NOT* AURORAS: The biggest geomagnetic storm in years erupted this month when a Cannibal CME slammed into Earth's magnetic field. Auroras spread as far south as California and New Mexico. Upon closer inspection, however, not all of the lights were auroras. Some were "SARs."

SARs are pure red arcs of light that ripple across the sky during strong geomagnetic storms. Here's an example from Finland in 2018:

sar_finland_strip.jpg

"The SAR was visible to the naked eye for nearly 30 minutes and, after fading a bit, remained visible to my camera for another hour and a half," recalls photographer Matti Helin.

On Nov 4, 2021, Earth experienced a veritable SAR storm. "We photographed SARs as far south as the McDonald Observatory in Texas," reports Jeff Baumgardner of Boston University's Center for Space Physics. "The bands of light swept over our cameras near Boston, then headed south. We knew something special was going on."

SARs look like auroras, but they not the same. Auroras appear when charged particles rain down from space, hitting the atmosphere and causing it to glow like the picture tube of an old color TV. SARs form differently. They are a sign of heat energy leaking into the upper atmosphere from Earth's ring current system.

During the storm on Nov. 4th, an all-sky camera in Capital Reef, Utah, caught a bright one. Play the movie and watch what happens at the 18-second mark:


"It is pretty unusual to see an SAR at this low latitude," says Asti Bhatt of SRI International. Bhatt operates MANGO, a continent-spanning network of cameras that monitors the sky for unusual phenomena like SARs.

SARs were discovered in 1956 at the beginning of the Space Age. Researchers didn't know what they were and unwittingly gave them a misleading name: "Stable Auroral Red arcs" or SARs. In fact, SARs are neither stable nor auroras.

"Our group has observed scores of SARs over the last three solar cycles," says Baumgardner. "In 2015 we published a paper describing them. We found that SARs are 'stable' only when compared to very active auroras. When you watch an SAR for an hour or so, it can be quite dynamic."

Space physicists are keen on SARs because they are linked to Earth's ring current--a donut-shaped circuit carrying millions of amps around our planet. The ring current skims the orbits of geosynchronous satellites and plays a huge role in determining the severity of geomagnetic storms. Earth is the only rocky planet that has one.

sar_space_strip.jpg

Above: SARs photographed by the Dynamics Explorer-1 satellite in 1982. More

SARs are among the reddest things in the sky, with a monochromatic glow at 6300 Å that comes from atomic oxygen in the upper atmosphere. Unfortunately, the human eye is relatively insensitive to light at this wavelength. SARs are usually so faint that no one notices when they pass overhead. Cameras catch them easily, though. Pro tip for photographers: Use a 6300 Å filter.

"At the peak of a solar cycle we typically photograph 30 SARs per year near Boston," says Baumgardner. "We hope this is a start of an active solar cycle with lots more SAR arcs!" "

C.f. also (posted Nov 1):
" AFTERGLOW OF A CME: A CME hit Earth's magnetic field on Oct. 31st. Its weak impact did not spark the strong geomagnetic storm forecasters expected. However, the afterglow was divine. Minoru Yoneto of Queenstown, New Zealand, took this picture as Earth was passing through the CME's wake:

Minoru-Yoneto-8366_1635728806_strip.jpg

"The auroras were faint," says Yoneto, "but we were lucky because they appeared on a clear night with a nearly New Moon. Please note that you need to use an astronomically modified camera to capture this much red color."

Red auroras were also seen in Tasmania. "The glow appeared in the south," says photographer Peter Sayers. "It was strong and visible from 9pm until 3am the next morning."

Among auroras, reds are the most delicate. They come from atomic oxygen near the top of Earth's atmosphere. Oxygen atoms excited by solar wind spit out red photons very slowly. The radiative lifetime of the transition is 110 seconds--an eternity at the quantum scale. The atoms must remain undisturbed that long to produce their eerie red light. Quiet, patience, and dark skies are required to catch them. Apparently, a weak Halloween CME helps, too. "
-----------------------------

& Now:

Still in the stream, even as we speak ... :
" Solar wind
speed: 533.4 km/sec
density: 8.2 protons/cm3
more data: ACE, DSCOVR
Updated: Today at 1320 UT

X-ray Solar Flares
6-hr max: A6 1214 UT Nov23
24-hr: A9 0242 UT Nov23
explanation | more data
Updated: Today at: 1325 UT

gray_gradient_line.jpg

spacer.gif
Daily Sun: 23 Nov 21
hmi200.gif

Expand: labels | no labels

spacer.gif
spacer.gif
A new sunspot is growing at the circled location. Credit: SDO/HMI "

...
 
Last edited:
  • Like
  • Informative
Likes collinsmark and sophiecentaur
  • #188
Nov. 25 (spaceweather.com announcement):

" GEOMAGNETIC STORM WATCH: Minor G1-class geomagnetic storms are possible on Nov. 27th when a CME is expected to sideswipe Earth's magnetic field. Click to watch the storm cloud leaving the sun yesterday:

cmesplash_strip.png

The CME was hurled into space by an erupting filament of magnetism in the sun's southern hemisphere. Flying upward, the filament split the sun's atmosphere, carving out a "canyon of fire" as it ascended. The glowing walls remained intact for more than 6 hours after the blast.

NOAA models of the CME suggest a glancing blow during the late hours of Nov. 27th. Much of the CME will miss, sailing south of our planet. But the fraction that hits should be enough to spark bright Arctic auroras. "

And the "canyon of fire" (that caused the CME):
canyonoffire.gif


(plus hit the link "canyon of fire" [in blue] above for motion ...)
 

Attachments

  • canyonoffire.gif
    canyonoffire.gif
    92.3 KB · Views: 132
Last edited:
  • #189
Finally it was only a weak impact. Sudden increase in speed on Nov. 27 (but not high in magnitude) and simultaneously a significant sudden rise in proton density ... etc. - problems in radio communications etc. were observed, but not a significant magnetic storm ...

(Plus posted on Nov. 29, 2021 : )
" AFTERGLOW OF A CME: A CME hit Earth's magnetic field on Nov. 27th (23:30 UT). The weak impact did not cause a geomagnetic storm, but there was a beautiful afterglow. Aurora tour guide Marianne Bergli photographed it from Tromsø, Norway:

Marianne-Bergli-8_1638120312_strip.jpg

"My guests were a little skeptical at first ... then Boom! Wow, Fantastic," she says. "The colors were absolutely amazing."

The display occurred hours after the CME struck. Earth was passing through the CME's wake when magnetic fields trailing the storm cloud opened a crack in our planet's magnetosphere. Solar wind poured in, sparking auroras around the Arctic Circle. This sequence is not uncommon. First contact with a CME often produces surprisingly little activity. "
 
  • Like
Likes collinsmark
  • #190
Dec 1 update:

" Solar wind
speed: 478.7 km/sec
density: 6.2 protons/cm3
more data: ACE, DSCOVR
Updated: Today at 1352 UT

X-ray Solar Flares
6-hr max: B1 1346 UT Dec01
24-hr: B2 1730 UT Nov30
explanation | more data
Updated: Today at: 1355 UT

gray_gradient_line.jpg

spacer.gif
Daily Sun: 30 Nov 21
hmi200.gif

Expand: labels | no labels

spacer.gif
spacer.gif
A new sunspot is growing at the circled location. Credit: SDO/HMI "

&

" GEOMAGNETIC STORM WATCH: Minor geomagnetic storms are possible on Dec. 3rd when a CME might sideswipe Earth's magnetic field. The storm cloud was hurled into space on Nov. 29th by an erupting filament of magnetism (movie) in the sun's southern hemisphere. According to NOAA computer models, the bulk of the CME should sail south of our planet with a near miss just as likely as a glancing blow. (...)

AURORA SURPRISE: Forecasters were not expecting this. On Nov. 30th, a co-rotating interaction region (CIR) hit Earth's magnetic field, sparking a G1-class geomagnetic storm. "It produced the strongest auroras of the season," says Markus Varik, who sends this picture from Tromsø, Norway:

cir_strip.jpg

CIRs are transition zones between slow- and fast-moving solar wind streams. They contain shock waves and strong magnetic fields that can mimic coronal mass ejections (CMEs), often producing colorful auroras when they arrive.

"There were dancing purples, pinks, curls, curtains ...you name it!" says Varik. "CIRs produce the most colorful auroras, based on my experience as a tour guide."

CIRs are notorously difficult to predict. This one arrived just ahead of a high-speed stream flowing from a northern hole in the sun's atmosphere. Forecasters expected the stream (and its CIR) to sail north of our planet--a complete miss. What happened instead was a pleasant surprise. "Observed increased solar wind since yesterday Nov 30 ...
(max speed 573Km/sec e.g. at 08:10 UT this morning etc.)
And just now:
" Solar wind
speed: 495.2 km/sec
density: 6.8 protons/cm3
more data: ACE, DSCOVR
Updated: Today at 1415 UT "
&
" Solar wind
speed: 506.0 km/sec
density: 6.3 protons/cm3
...
Updated: Today at 1421 UT "Later edit supplement:

" In Abisko, Sweden, Lights over Lapland tour guide Claudio Comi was off-duty, but he couldn't resist dashing out for an impromptu self-portrait:

sp_strip.jpg

CIRs are transition zones between slow- and fast-moving solar wind streams. They contain shock waves and strong magnetic fields that can mimic coronal mass ejections (CMEs), often producing bright auroras when they arrive.

"The auroras became very active after the CIR arrived, and a powerful corona danced overhead," says Comi. "I captured this image at the peak of the display and can say that it was one of the best auroras I have ever seen." "
 
Last edited:
  • Like
Likes collinsmark
  • #191
Some interesting Solar behaviour and Activity since the previous posts, despite no posting etc. - you can see spaceweather.com almanac for details etc. ...

Huge sunspot appearing recently (of the biggest in this cycle etc.) and interesting recent activity these days etc. ... :

GEOMAGNETIC STORM WATCH: A CME is coming, and it is likely to hit Earth's magnetic field on Feb. 2nd. Moderately-strong G2-class geomagnetic storms are possible when the CME arrives. If the storm materializes as expected, it could set the stage for mid-latitude auroras visible in northern tier US states.
[Concerns other countries too (northern hemisphere ...) ... (depending on latitude etc. and the exact location ...)

(plus warnings for radio blackouts etc. and internet connections around the globe etc. - however regular and mild [still] expected routine perhaps solar phenomena at this point ... - no big worries ... - just caution and for knowledge of possible causes of/for possible events ... - better than not knowing, I think, always, & just in case ...)]Latest picture of spots etc.:

Daily Sun: 31 Jan 22
hmi200.gif

Expand: labels | no labels

spacer.gif
spacer.gif
Big sunspot AR2936 poses a continued threat for M-class solar flares. Credit: SDO/HMIPlus cf. https://www.physicsforums.com/threads/solar-imaging-and-techniques.925656/post-6594059
 
  • #192
"GEOMAGNETIC STORM BRINGS DOWN STARLINK SATELLITES: As many as 40 Starlink satellites are currently falling out of the sky--the surprising result of a minor geomagnetic storm. SpaceX made the announcement yesterday:

"On Thursday, Feb. 3rd at 1:13 p.m. EST, Falcon 9 launched 49 Starlink satellites to low Earth orbit from Launch Complex 39A (LC-39A) at Kennedy Space Center in Florida. ... Unfortunately, the satellites deployed on Thursday were significantly impacted by a geomagnetic storm on Friday, [Feb. 4th]."

kindex_starlink_strip.png

Two days before launch a CME hit Earth's magnetic field. It was not a major space weather event. In fact, the weak impact did not at first spark any remarkable geomagnetic activity. However, as Earth passed through the CME's wake, some sputtering G1-class geomagnetic storms developed. It was one of these minor storms that caught the Starlink satellites on Feb. 4th.

Geomagnetic storms heat Earth's upper atmosphere. Diaphanous tendrils of warming air literally reached up and grabbed the Starlink satellites. According to SpaceX, onboard GPS devices detected atmospheric drag increasing "up to 50 percent higher than during previous launches."

"The Starlink team commanded the satellites into a safe-mode where they would fly edge-on (like a sheet of paper) to minimize drag," says SpaceX. "Preliminary analysis show the increased drag at the low altitudes prevented the satellites from leaving safe-mode to begin orbit raising maneuvers, and up to 40 of the satellites will reenter or already have reentered the Earth’s atmosphere."

The Sociedad de Astronomia del Caribe apparently caught one of the reentries over Puerto Rico on Feb. 7th:


SpaceX says that the deorbiting satellites "pose zero collision risk with other satellites and by design demise upon atmospheric reentry—meaning no orbital debris is created and no satellite parts hit the ground."

Keep an eye on the night sky this week. You might catch a Starlink satellite burning up overhead."
 
  • #193
This was 3 days ago (Feb 16, 2022):
"HUGE EXPLOSION ON THE FARSIDE OF THE SUN: Earth might have just dodged a bullet. Earlier today, NASA's STEREO-A spacecraft observed a tremendous coronal mass ejection (CME) emerging from the farside of the sun. Helioseismic maps of the sun's farside suggest that a huge sunspot group may be responsible, and it will soon turn to face Earth. See the data and more @ Spaceweather.com. "

The same sunspot responsible for the failing of the multiple (~40) starlink satellites (on Feb 4) is behind this huge explosion too on the farside (Feb 16), returning very soon. It might be intetesting ...

(+Suppl. today, just now, Feb 20, 2022 [early am hours/UT]) Right now increased solar wind & radio blackout in SW & MW bands ...
" Solar wind
speed: 476.4 km/sec
density: 13.5 protons/cm3
more data: ACE, DSCOVR
Updated: Today at 0030 UT

X-ray Solar Flares
6-hr max: C1 1942 UT Feb19
24-hr: C1 1942 UT Feb19
explanation | more data
Updated: Today at: 0035 UT

Daily Sun: 19 Feb 22
hmi200.gif

Expand: labels | no labels

spacer.gif
spacer.gif
All fours of these sunspot groups have stable magnetic fields that pose little threat for strong flares.. Credit: SDO/HMI "

And more recent:
"Solar wind
Speed: 491.6 km/sec
density: 28.0 protons/cm3
more data: ACE, DSCOVR
Updated: Today at 0140 UT
"

The "radio storm" seems to have ended though. It must have been either a crack in Earth's magnetic field (e.g. due to the high wind) or even a live solar flare ... (we'll see the data analysis tomorrow).

And local max for speed just now (minutes ago):

"Solar wind
speed: 499.9 km/sec
density: 27.3 protons/cm3
more data: ACE, DSCOVR
Updated: Today at 0145 UT

X-ray Solar Flares
6-hr max: B9 1950 UT Feb19
24-hr: C1 1942 UT Feb19
explanation | more data
Updated: Today at: 0150 UT "

And further increase, just before closing this live watch:

"Solar wind
speed: 512.1 km/sec
density: 20.7 protons/cm3
more data: ACE, DSCOVR
Updated: Today at 0200 UT"

P.S.: + even further increase and more radio interference just now:
" Solar wind
speed: 519.1 km/sec
density: 22.4 protons/cm3
more data: ACE, DSCOVR
Updated: Today at 0230 UT

X-ray Solar Flares
6-hr max: B8 0220 UT Feb20
24-hr: C1 1942 UT Feb19
explanation | more data
Updated: Today at: 0235 UT "
 
Last edited:
  • Like
Likes collinsmark, sophiecentaur and Oldman too
  • #194
Stavros Kiri said:
The "radio storm" seems to have ended though. It must have been either a crack in Earth's magnetic field (e.g. due to the high wind) or even a live solar flare ... (we'll see the data analysis tomorrow).
"SOLAR WIND SPARKS GEOMAGNETIC STORM: A solar wind stream hit Earth's magnetic field during the early hours of Feb. 20th, sparking a minor G1-class geomagnetic storm. Earth is still inside the stream, which is flowing from a southern hole in the sun's atmosphere. High-latitude sky watchers should remain alert for auroras."

The wind speed right now was at 512 km/sec with a low density of 8.8 protons/cm³ (while just a bit earlier it was 519..., 9.2 ...).

+ More interesting behaviour is expected:

A)
"FLARES ON THE HORIZON: The northeastern limb of the sun is surging with flares--a sign that old sunspot AR2936 (described below) is about to return. NASA's Solar Dynamics Observatory recorded thisC5-class explosion during the early hours of Feb. 20th:

c5_strip.gif

The flare was stronger than it appeared. It was partially eclipsed by the edge of the sun. Unobstructed, the explosion was probably M-class. The underlying sunspot will soon emerge into view, potentially exposing Earth to a source of strong flares."

B)
"HERE IT COMES: The source of last week's huge farside explosion is moving closer to the Earthside of the sun. NASA's STEREO-A spacecraft is stationed just behind the sun's eastern limb, and it has caught sight of a large ultraviolet hotspot approaching the visible edge of the solar disk:

farside_strip.jpg

STEREO-A does not have a white light telescope, so we cannot know for sure that the "hotspot" is actually a sunspot. But it almost certainly is.

Whatever it is, it's big enough to affect the way the surface of the sun vibrates. Researchers at Stanford University are using helioseismology to map the farside of the sun. They've detected something big at the same location:

helioseismology_strip.jpg

The timing and location of this active region suggest that it is old sunspot AR2936--the same sunspot that brought down multiple Starlink satelites in early February. It has grown during its transit around the farside of the sun, and could pose an even greater threat when it returns in a few days." (actually about to return now ...)

C) Latest look/picture:
(and speed local max - after that it dropped temporarely, oscillating ...)
" Solar wind
speed: 525.3 km/sec
density: 8.7 protons/cm3
more data: ACE, DSCOVR
Updated: Today at 1415 UT

X-ray Solar Flares
6-hr max: B4 1218 UT Feb20
24-hr: C5 0407 UT Feb20
explanation | more data
Updated: Today at: 1420 UT

gray_gradient_line.jpg

spacer.gif
Daily Sun: 20 Feb 22
hmi200.gif

Expand: labels | no labels

spacer.gif
spacer.gif
Keep an eye on the circled location for the return of old sunspot AR2939, which caused a huge farside explosion last week. Credit: SDO/HMI"
 
Last edited:
  • Like
Likes collinsmark
  • #195
"SOLAR WIND STREAM APPROACHES EARTH: A stream of solar wind is approaching Earth. Estimated time of arrival: March 5th. The gaseous material is flowing from an equatorial hole in the sun's atmosphere, and it could spark minor geomagnetic storms when it arrives."
 
  • #196
"X-ray Solar Flares
6-hr max: B9 1122 UT Mar04
24-hr: C3 2155 UT Mar03
explanation | more data
Updated: Today at: 1405 UT
spacer.gif
gray_gradient_line.jpg

spacer.gif
Daily Sun: 04 Mar 22
hmi200.gif

Expand: labels | no labels

spacer.gif
spacer.gif
Sunspot AR2960 is growing rapidly and poses the greatest threat for flares today. Credit: SDO/HMI"

"Solar wind
speed: 449.3 km/sec
density: 7.1 protons/cm3
more data: ACE, DSCOVR
Updated: Today at 1506 UT"

Speed max so far was seen at 10:41 UT, 484km/sec

And just now (local max with an increasing again tendency):

"Solar wind
speed: 454.7 km/sec
density: 7.3 protons/cm3
more data: ACE, DSCOVR
Updated: Today at 1515 UT"

Note: My personal assesment is that we already have entred in the initial incoming stream (and some minor radio interference is present).
 
Last edited:
  • #197
Today March 6:
"GEOMAGNETIC STORMS ARE SUBSIDING: A series of minor G1-class geomagnetic storms erupted on March 5-6 as a stream of high-speed solar wind buffeted our planet's magnetic field. Now, Earth is exiting the stream and the storms are subsiding."
The speed was on ~average mainly ~550Km/sec (plus or minus ...)
A max of ~604Km/sec speed was reached during the storm (today, early morning UT hours) ...
[Some (minor perhasps) radio interference was observed on some AM bands (LW, MW, SW) ...]

Now:
"Solar wind
speed: 494.7 km/sec
density: 5.9 protons/cm3
more data: ACE, DSCOVR
Updated: Today at 2115 UT
spacer.gif
X-ray Solar Flares
6-hr max: B5 2030 UT Mar06
24-hr: C2 0237 UT Mar06
explanation | more data
Updated: Today at: 2120 UT
spacer.gif
gray_gradient_line.jpg

spacer.gif
Daily Sun: 06 Mar 22
hmi200.gif

Expand: labels | no labels

spacer.gif
spacer.gif
New sunspot AR2962 is crackling with C-class solar flares. Credit: SDO/HMI"[Posted (in spacewather.com) March 5]
"A PLASMA VORTEX ON THE SUN: Imagine a vortex of hot plasma wide enough to swallow Earth swirling faster than 50,000 mph. Actually, here it is:

vortex2_strip_opt.gif

Amateur astronomer Alexander Golitschek photographed the structure yesterday with his local astroonomy club in Darmstadt, Germany. "I recorded this 25 minute movie using a Lunt Solar Systems 152mm H-alpha solar telescope," he says. "I estimate the loop's outer diameter as twice that of Earth."

The vortex might not last long. It gets its structure from curling magnetic fields, which confine the plasma into a loop. At this very moment the loop is winding tighter and tighter--a buildup of tension that could tear the vortex apart."

And latest watch (still today March 6):
"Solar wind
speed: 513.1 km/sec
density: 6.9 protons/cm3
more data: ACE, DSCOVR
Updated: Today at 2146 UT
spacer.gif
X-ray Solar Flares
6-hr max: B8 2140 UT Mar06
24-hr: C2 0237 UT Mar06
explanation | more data
Updated: Today at: 2150 UT"
(Local speed max ... [still oscillating up and down])
 
Last edited:
  • Like
Likes collinsmark
  • #198
Increased to strong radio interference observed (on AM bands [i.e. MW (mainly), LW and low frequency SW bands]) at this point and a bit earlier (though outside of storm, as of now etc.) for no obvious reason perhaps (at this point) ... - communications caution etc. [is advised] and possible auroras perhaps ... - it could be a crack in Earth's magnetic field ... - we'll see (later perhaps).

An ok level of solar wind speed but really remarkably low proton densities etc. (i.e. on the low side etc.) at this point ... [today March 9, 2022, early morning UT hours ...]

" Solar wind
speed: 413.0 km/sec
density: 2.7 protons/cm3
more data: ACE, DSCOVR
Updated: Today at 0245 UT

X-ray Solar Flares
6-hr max: C1 2227 UT Mar08
24-hr: C2 0313 UT Mar08
explanation | more data
Updated: Today at: 0250 UT

gray_gradient_line.jpg


spacer.gif
Daily Sun: 08 Mar 22
hmi200.gif

Expand: labels | no labels

spacer.gif
spacer.gif
A new and possibly large sunspot is emerging at the circled location. Credit: SDO/HMI "

AND

" Solar wind
speed: 414.4 km/sec
density: 2.7 protons/cm3
more data: ACE, DSCOVR
Updated: Today at 0324 UT

X-ray Solar Flares
6-hr max: C1 2227 UT Mar08
24-hr: C1 2227 UT Mar08
explanation | more data
Updated: Today at: 0330 UT "
[LOCAL MAX for speed]

AND
" Solar wind
speed: 408.5 km/sec
density: 3.2 protons/cm3
more data: ACE, DSCOVR
Updated: Today at 0345 UT

X-ray Solar Flares
6-hr max: C1 2227 UT Mar08
24-hr: C1 2227 UT Mar08
explanation | more data
Updated: Today at: 0350 UT "

AND (then significant sudden dropping ...) [e.g.] :

" Solar wind
speed: 255.3 km/sec
density: 2.3 protons/cm3
more data: ACE, DSCOVR
Updated: Today at 0405 UT

X-ray Solar Flares
6-hr max: C1 2227 UT Mar08
24-hr: C1 2227 UT Mar08
explanation | more data
Updated: Today at: 0410 UT "

[With an overall min of ~249Km/sec at 04:10 UT ...]
[and a similar smaller and shorter such drop[/possibly smaller ~crack...] later (after the subsequent set of data ...), after oscillating, with local [isolated point] speed min of 269Km/sec at 04:52 UT ...]

AND then rising back up higher, e.g. :
[LOCAL and OVERALL max (of speed) for now ...]
"Solar wind
speed: 416.2 km/sec
density: 2.6 protons/cm3
more data: ACE, DSCOVR
Updated: Today at 0411 UT

X-ray Solar Flares
6-hr max: C1 2227 UT Mar08
24-hr: C1 2227 UT Mar08
explanation | more data
Updated: Today at: 0415 UT "

Further, oscillating a bit up&down ... :
" Solar wind
speed: 405.2 km/sec
density: 4.0 protons/cm3
more data: ACE, DSCOVR
Updated: Today at 0419 UT

X-ray Solar Flares
6-hr max: C1 2227 UT Mar08
24-hr: C1 2227 UT Mar08
explanation | more data
Updated: Today at: 0425 UT "
(with a local min at 0415 UT of ~ 402... (or 403... [?]) ...)

[For example,] It could be another crack due to e.g. a CIR passing (the data above resembles a bit) - I am waiting on possible auroras reports ...

Finally, before closing this almost live watch, another major drop (resembles a CIR again ...):

"Solar wind
speed: 396.1 km/sec
density: 5.1 protons/cm3
more data: ACE, DSCOVR
Updated: Today at 0440 UT

X-ray Solar Flares
6-hr max: B4 0004 UT Mar09
24-hr: C1 2227 UT Mar08
explanation | more data
Updated: Today at: 0445 UT "

Later look (another relative rising again as part of oscillation - not a significant new phenomenon):
"Solar wind
speed: 417.1 km/sec
density: 2.6 protons/cm3
more data: ACE, DSCOVR
Updated: Today at 0630 UT

X-ray Solar Flares
6-hr max: B4 0058 UT Mar09
24-hr: C1 2227 UT Mar08
explanation | more data
Updated: Today at: 0635 UT "

And local speed max
" Solar wind
speed: 422.0 km/sec
density: 2.9 protons/cm3
more data: ACE, DSCOVR
Updated: Today at 0634 UT

X-ray Solar Flares
6-hr max: B4 0058 UT Mar09
24-hr: C1 2227 UT Mar08
explanation | more data
Updated: Today at: 0640 UT "

And with full new day data now [morning, Wed, March 9, 2022] (and local/global speed max around that point of ~426Km/sec [at 06:23UT]):
" Solar wind
speed: 425.0 km/sec
density: 2.6 protons/cm3
more data: ACE, DSCOVR
Updated: Today at 0645 UT

X-ray Solar Flares
6-hr max: B6 0647 UT Mar09
24-hr: C1 2227 UT Mar08
explanation | more data
Updated: Today at: 0650 UT

gray_gradient_line.jpg

spacer.gif
Daily Sun: 09 Mar 22
hmi200.gif

Expand: labels | no labels

spacer.gif
spacer.gif
Sunspot AR2960 has a 'beta-gamma' magnetic field that habors energy for M-class solar flares. Credit: SDO/HMI "

While a bit later followed by another speed drop and [a] local minimum for proton density, and right after local min (for speed) ...
"Solar wind
speed: 398.0 km/sec
density: 1.5 protons/cm3
more data: ACE, DSCOVR
Updated: Today at 0705 UT

X-ray Solar Flares
6-hr max: B6 0703 UT Mar09
24-hr: C1 2227 UT Mar08
explanation | more data
Updated: Today at: 0710 UT "

" Solar wind
speed: 378.1 km/sec
density: 1.6 protons/cm3
more data: ACE, DSCOVR
Updated: Today at 0716 UT

X-ray Solar Flares
6-hr max: B6 0703 UT Mar09
24-hr: C1 2227 UT Mar08
explanation | more data
Updated: Today at: 0720 UT "

Note: Global min for proton density 1.07protons/cm3 at 04:10 UT ... see above - global speed min there too ...

End of this watch (for now).

Useful announcement:
"POSSIBLE CME IMPACT THIS WEEK: A faint CME (movie) might sideswipe Earth's magnetic field on March 10th. It left the sun on March 7th following the eruption of a magnetic filament; no sunspots were involved. The glancing blow could spark minor G1-class geomagnetic storms later this week."
 
Last edited:
  • #199
1)
"A CME PASSED BY EARTH YESTERDAY: During the late hours of March 10th, a CME passed by Earth. Ripples from the near miss sparked auroras in northern Europe bright enough to see through city lights. Another CME is coming, but it won't miss. Details below."

2)
"GEOMAGNETIC STORM WATCH (CATEGORY G2): A full-halo CME is heading directly for Earth. ETA: late on March 13th. Coronagraphs onboard the Solar and Heliospheric Observatory (SOHO) recorded the storm cloud leaving the sun earlier today:

fullhalo_opt.gif

Note: The bright "star" at the lower right of the sun is Jupiter.​

This CME is the result of a long duration C2-class solar flare near sunspot AR2962. Normally, C-class flares are not considered to be strong. However, this one lasted nearly 12 hours, allowing it to pump plenty of energy into the CME.

Moderately-strong G2-class geomagnetic storms are possible after the CME arrives. During such storms, naked-eye auroras may appear in northern-tier US states from Maine to Washington. Power grids and satellites will experience little to no effect, however.

A new model of the CME from NASA pinpoints the arrival time around 1800 UT on March 13th. In this animation, the yellow dot is Earth:

nasamodel_crop_strip_opt.gif

Geomagnetic storms, if they materialize, could spill into March 14th, making this a Pi Day geomagnetic storm. That's appropriate. After all, auroras form a circle around Earth's magnetic poles.

Take another look at the NASA model. The CME hits Venus less than a day before it reaches Earth. The CME won't spark a geomagnetic storm on Venus. It can't; the planet has no internally-generated global magnetic field. Instead, the impact will erode a small amount of atmosphere from Venus' unprotected cloudtops.

Geomagnetic storms: One of the perks of living on Earth. High latitude sky watchers should be alert for auroras on March 13-14."

3)
" Solar wind
speed: 411.6 km/sec
density: 6.8 protons/cm3
more data: ACE, DSCOVR
Updated: Today at 2245 UT
spacer.gif
X-ray Solar Flares
6-hr max: M2 2232 UT Mar11
24-hr: M2 2232 UT Mar11
explanation | more data
Updated: Today at: 2250 UT
spacer.gif
gray_gradient_line.jpg

spacer.gif
Daily Sun: 11 Mar 22
hmi200.gif

Expand: labels | no labels

spacer.gif
spacer.gif
The most active sunspot on the sun today is AR2965, which is crackling with C-class solar flares. Credit: SDO/HMI "

4)
"M-CLASS SOLAR FLARE: Earth orbiting satellites have just detected an M2-class solar flare from sunspot AR2964: movie. A pulse of X-rays ionized the top of Earth's atmosphere, causing a brief shortwave radio blackout over the Pacific Ocean. This flare is not expected to produce a significant CME."
 
  • #200
March 13
1)
"A BIG CRACK IN EARTH'S MAGNETIC FIELD: For an hour on March 13th, a big crack opened in Earth's magnetic field--one of the biggest in years. (For specialists: BsubZ was less than -20 nT.) Solar wind poured through the gap, adding its energy to that of the CME which struck earlier in the day. This increases the chances that high-latitude auroras may remain visible at least through the early hours of March 14th."

2)
"CME IMPACT SPARKS GEOMAGNETIC STORM: As predicted, a CME hit Earth's magnetic field on March 13th. The impact sparked a moderately strong G2-class geomagnetic storm. When the CME arrived, "the sky exploded," reports John Dean, who sends this picture from Nome, Alaska:

alaska_strip.jpg

..."

March 14
1)
"SUBSIDING GEOMAGNETIC STORM: A G2-class geomagnetic storm that began on March 13th when a CME hit Earth's magnetic field is subsiding now. It could flare up again as Earth moves through the CME's magnetized wake, but probably as a weaker G1-class storm. Auroras will retreat to the Arctic Circle on March 14th. "

2)
"CME IMPACT SPARKS BRIGHT AURORAS: As predicted, a CME hit Earth's magnetic field on March 13th. The impact sparked a moderately strong G2-class geomagnetic storm, which lasted more than 12 hours. "It was the best Northern Lights show for years," reports Jónína Óskarsdóttir, who sends this picture from Fáskrúðsfjörður, Iceland:

iceland_strip.jpg

Other observers echoed Óskarsdóttir. "Best display I've seen in years," says Alan C. Tough of Moray, Scotland. "Brightest aurora in 7 years," reports Laura Kranich of Kiel, Germany. "This was the best I've seen here in the south of Norway," says Liz Gyurgyak.

In addition to auroras, the CME also jolted Earth's magnetic field and caused electricity to flow through the soil of northern Norway. Citizen scientist Rob Stammes measured these effects from his space weather observatory in the Lofoten islands.

The whole episode is a sign of strength from young Solar Cycle 25--and a hint of things to come. If forecasters are correct, Solar Max will arrive in 2 to 3 years bringing even stronger storms. If you haven't seen auroras yet, you might soon."
 

Similar threads

Replies
2
Views
3K
Replies
1
Views
5K
Replies
1
Views
3K
Replies
1
Views
4K
Back
Top