Hi Chet,
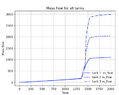
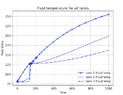
I've got the cooling/heating of the packed bed fully working now. And here is a plot of a number of charge/discharge (cooling/heating) cycles:
View attachment 314754
The simulation details:
Bed initial temperature = 80K
Fluid inlet temperature = 293K
The discharge (bed heating) is run until the last position in the bed (position 4 in this case) heats up to a temperature of 1K above 80K i.e. 81K. This signals that the bed can no longer cool the gas to 80K and liquefy it.
Then, from the outlet (position 4) liquid gas at 80K is passed through for the same amount of time, and the bed recools. It won't recoil all the way to 80K though because of some losses.
Then again hot air is passed through until the last position increases by 1K etc this repeats for a few cycles and the final temperature profiles after each cooling phase are plotted above. If this cycle was repeated a large number of times then eventually we would no longer be able to liquefy air (and the bed would undergo a full cooling phase to fully reset the temperature to 80K)
My question is how can I quantify how the performance of the bed degrades over time?
I was thinking of using the time required to increase the last position by 1K. If I store this value for each cycle, we should see that this time decreases (as the bed performance degrades). We can do ## moles-of-liquid-lost = \Delta t * \dot{m}## to calculate the amount of moles we lose per cycle, compared to the theoretical max. Does this sound reasonable?