Revisiting The Deuterium Lyman Alpha Line Experiment
Table of Contents
Introduction
In this article, we will be revisiting a somewhat understudied (and seemingly unrepeated) experiment to measure the Deuterium Lyman Alpha line at approximately 121.5 nm. The experiment was carried out in the 1950s in the wake of the Lamb-Retherford experiment (1947) which established the tiny energy shift (Lamb shift) between the Hydrogen (and Deuterium) 2s and 2p 1/2 energy levels. According to the Dirac Energy equation, these two levels should be exactly equivalent but this experiment proved otherwise and hence ushered in the era of quantum electrodynamics. Such theory predicted that a similar shift – approximately 8 times greater in magnitude – should exist in the ground state (1s level) of atomic hydrogen and/or deuterium (ground state Lamb shift) and it was this that experimental physicist Gerhard Herzberg set out to measure. In his own words:
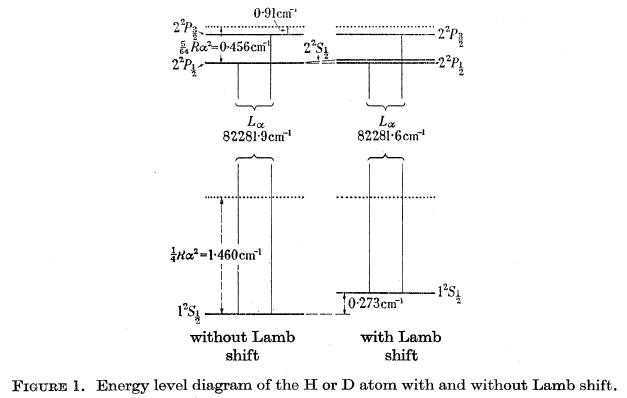
Unfortunately, an experimental determination of the shift for 1 S is beset with considerable difficulties. These difficulties are apparent from a consideration of Figure 1, which shows the n = 1 and n = 2 levels of hydrogen without and with electrodynamic shift. For comparison, the Bohr levels are shown by dotted lines. The crux of the matter is that there is no level close to 1 S with which it can be compared. The nearest levels are ##2P_{1/2} ## and ##2P _{3/2} ## which lie (about) 82 000 ##cm^{-1}## above 1 S. Thus, to establish a shift of 0.27 ##cm^{-1}##, the energy difference ##1S-2P _{3/2} ##, that is, the wavenumber of the Lyman Alpha line, must be determined with very considerable accuracy to better than one part in a million.
Summary of Experimental Method and Results
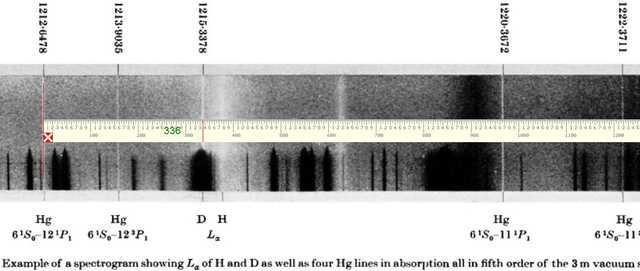
In this article, we will not delve too deeply into the details of Herzberg’s experimental method. The interested reader is encouraged to read the relevant paper referenced below. Suffice it to say he decided that for technical reasons measurement of Deuterium Lyman Alpha would be a better bet than of the same line in Hydrogen. He used a “3-metre vacuum grating spectrograph in fifth-order” and the Deuterium line was photographed alongside highly accurate Mercury standard lines which could be used to calibrate the wavelength scale. It was also decided to measure both the Mercury standard lines and the Lyman Alpha line in absorption rather than emission.
Herzberg had perhaps hoped that his equipment would be able to resolve the Deuterium ##2p_{3/2}## and ##2p_{1/2}## levels but was thwarted by Doppler broadening of both lines resulting in a single merged line. As a consequence the final measurement was of an “unresolved doublet” and he had to resort to theoretical line profiling to establish a value for the ##2p_{3/2}## level from the measurement. Herzberg’s final measurement (from an average of 6 different plates obtained) was: $$L_\alpha(D)=1215.3378\pm0.00025 Å$$Using the line profiling mentioned above, this was adjusted by -0.0003Å to give a final value of the transition ##1s-2p_{3/2}## (measured) as ##1215.3375\pm0.00025 Å## or ##82281.67\pm0.02 cm^{-1}##. Subtracting this value from the Dirac energy determination of the same transition at ##82281.933cm^{-1}## gave a first measure of the so-called “ground state Lamb shift”: $$ΔE(1,0)\approx 0.26 cm^{-l}$$
Herzberg’s measurement of Lyman Alpha (Deuterium) is still recorded in the NIST spectral database as the most accurately obtained observation of this particular transition (##1S-2p_{3/2}##) although the 1S-2S transition has subsequently been measured several orders of magnitude more precisely. Given the precision of the 1S-2S measurement, it’s perhaps a little surprising that the p-levels have not been similarly ascertained. It is possible that the 1s – 2p 3/2 transition can alternatively be measured as a sum of transitions – ie 1s-2s, 2s-2p 1/2, and finally 2p 1/2 – 2p 3/2.
Revisiting the Herzberg Experiment
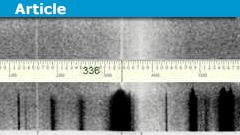
Our starting point for an attempt at re-measuring the Deuterium Lyman Alpha line will be the following photograph of one of the plates that Herzberg used in his measurement. The salient details of this spectrum are the four Mercury standard lines placed two to the left and two to the right of the Deuterium Lyman Alpha line to be measured. Using “pixel ruler spectroscopy” we will measure (as accurately as possible) the four Mercury standard lines and then apply linear regression (pixels vs known wavelengths) to calibrate the wavelength scale and hence obtain our measure of ##L_\alpha(D)##. At the outset, it should be noted that the photograph shown below is not of a particularly high resolution and therefore we should not expect to match Herzberg’s stated uncertainty value of ##\pm 0.00025Å##. To demonstrate the technique to be used, the photograph includes our pixel ruler measurement (336 pixels) of the Lyman Alpha line relative to the first of the two standards at left.
Similarly, the remaining 3 standard lines are measured and it is a relatively simple process thereafter to determine a regression equation linking pixel measurement to wavelength in Angstrom units and thereby determine the measured wavelength of the Lyman Alpha line. Results are shown in the following screenshot of an Excel spreadsheet used to carry out the necessary regression analysis (calibration of wavelength scale).
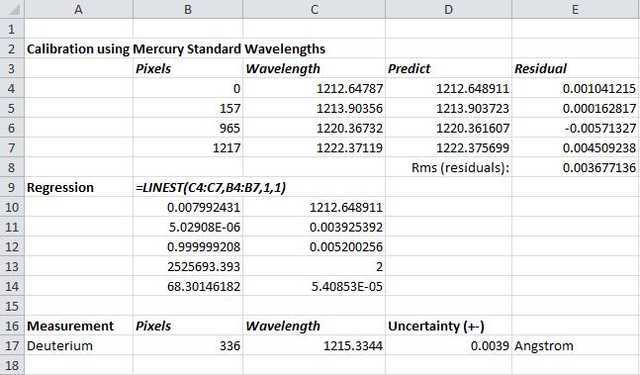
The coefficients of the calibration equation are shown in cells B10 and C10 above – this equation is then used to ‘predict’ the standard lines so that residual values can be calculated and averaged (root mean square: cell E8) to give an idea of the expected measurement uncertainty. To be as conservative as possible with the uncertainty estimate, the error in the y-intercept of the calibration curve (C11 above) is rather used although it is not very different from the RMS value of the residuals. It is however clear that the measurement uncertainty is at least an order of magnitude greater than the 0.00025 Å given in the Herzberg paper.
Calculation of Lyman Alpha (Deuterium) Wavelength
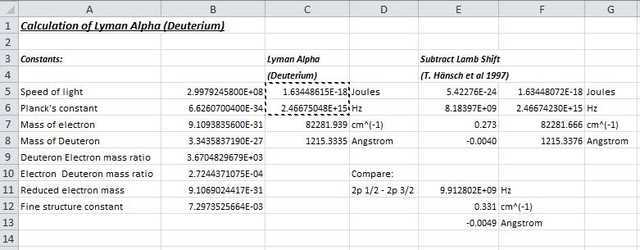
To discuss the above measurement we first need to show a theoretical calculation of the Lyman Alpha wavelength using the same simplified Dirac energy formula which we have used (in previous articles) to calculate the Balmer alpha line of atomic hydrogen as well as the 4-3 transition of singly ionized Helium:
$$ E_{n}=\mu c^2\sqrt{1-\frac{Z^2\alpha^2}{n^2}} $$
Since the above formula is also applicable to the Deuterium 1S and 2p 3/2 levels, we can calculate the transition energy as follows:
$$D_{1S-2p_{3/2}}=E_2-E_1=\mu c^2\left(\sqrt{1-\frac{\alpha^2}{4}}-\sqrt{1-\alpha^2}\right) $$ where ## \alpha ## is the fine structure constant and ## \mu ## the reduced electron mass for a single electron bound to the Deuterium nucleus. Z=1 for Hydrogen and Deuterium and reduced mass is calculated as follows from electron mass and deuteron mass: $$\mu_{D} = \frac{m_e\times m_{D}}{m_e+m_{D}} $$.
Putting it all together and dividing through by hc (product of Planck’s constant and velocity of light) to convert to wavenumber, we obtain: $$L_\alpha(D)=82281.939cm^{-1}$$ This translates to a wavelength of $$1215.3335 Å$$ The wavenumber is slightly different from that quoted by Herzberg ##(82281.933cm^{-1})## probably because the physical constants used in the calculation have altered slightly since 1956. Had Herzberg used our calculated Dirac energy value, his estimate of the ground state Lamb shift value would be ## 0.27cm^{-1} ## – even closer to the stated theoretical shift of ##0.272 cm^{-1}##. That his measurement “improves with age” is surely a tribute to his very meticulous experimental method.
Discussion of Results
Given the somewhat limited resolution of the photograph from which we have worked, the wavelength obtained – ie 1215.3344 Å – is in very good agreement with the Dirac energy value calculated above. However, it is simply not a precise enough measurement to use for Herzberg’s original intent – measuring ground state Lamb shift. Herzberg’s measurement of 1215.3378Å is however contained within the spread of values set by the measurement uncertainty of ##\pm 0.0039Å## – albeit very close to the upper limit.
If it is possible to obtain a much higher resolution photograph or scan of (one or more of) Herzberg’s plates, it might be a worthwhile exercise to ‘re-run’ the pixel measurement exercise. This author did in fact ‘re-run’ the measurement countless times (at various ‘zoom’ levels on the photo) with varying results but almost invariably towards the short side (wavelength-wise) of Herzberg’s value and generally much closer to that obtained directly from the Dirac energy value. For example, if the photograph is ‘zoomed’ to the maximum extent, the printer pixels become apparent and ‘measurement’ then becomes a ‘quantum’ exercise to identify the exact (printer) pixel numbers at which the various lines fall. We conclude with the processing of this particular set of readings per the spreadsheet below:
![]()
Addendum: Units of Measure and Conversions
A somewhat confusing aspect of Atomic Physics is the plethora of different units that are used. For example, one finds energy measured in SI Joules, in electron volts, in units of frequency (Hz), and units of ‘reciprocal wavelength’ or wave number – typically ##cm^{-1}##. No doubt there are others as well.
Aside from electron volts, all of these different units relate to the Planck-Einstein relationship: $$E=hf$$ and the standard wavelength/frequency relationship for electromagnetic waves: $$ f = \frac{c}{\lambda} $$ where c is the velocity of light. Putting these together, we obtain $$E=hf=h\frac{c}{\lambda}$$.
Hence the Planck constant h links frequency (Hz) to energy (J) whilst the product hc links reciprocal wavelength or wavenumber (##cm^{-1}##) to energy (J). As an example, the following spreadsheet shows a calculation of Dirac energy in SI units (Joules) followed by conversion to units of frequency (Hz) and wave number (##cm^{-1}##). Note that for the latter there will be an additional factor of 100 changing from “per m” to “per cm”. The reciprocal of wavenumber (x 1E8) gives wavelength in Angstrom units.
Ground state Lamb shift is also shown in various units and compared against the shift between levels in the 2p orbital ie 2p 1/2 and 2p 3/2. From this, it becomes apparent that Herzberg was attempting to measure a shift even less than the minimum possible line width of the “unresolved doublet”!
Acknowledgments
Many thanks to PF member mfb whose review of this article resulted in the above Addendum on units of measure as well as a few other alterations in the script.
Some queries relating to the Mercury standards were answered by always helpful NIST staff.
‘Pixel Ruler Spectroscopy’ would of course be impossible without the very excellent tools available for free (or at nominal cost) on the Internet. The ruler I have made the most use of is PixelRuler available from the following website:
https://www.pixelruler.de/index.htm
Google’s Page Ruler available within the context of the Chrome browser also has some great facilities.
References
| [1] | G. Herzberg. Lamb shift of the 12s ground state of deuterium. Proceedings of the Royal Society of London. Series A, Mathematical and Physical Sciences, 234(1199):516-528, 1956. [ bib | http ] |
| [2] | A. Kramida. Re-optimized energy levels and Ritz wavelengths of 198Hg I. J. Res. Natl. Inst. Stand. Technol., 116:599-619, 2011. [ bib | DOI ] |
| [3] | A. Kramida, Yu. Ralchenko, J. Reader, and and NIST ASD Team. NIST Atomic Spectra Database (ver. 5.6.1), [Online]. Available: https://physics.nist.gov/asd [2019, September 20]. National Institute of Standards and Technology, Gaithersburg, MD., 2018. [ bib ] |
| [4] | M. Weitz, A. Huber, F. Schmidt-Kaler, D. Leibfried, W. Vassen, C. Zimmermann, K. Pachucki, T. W. Hänsch, L. Julien, and F. Biraben. Precision Measurement of the 1s Ground-state Lamb shift in atomic hydrogen and deuterium by frequency comparison. Phys. Rev. A, 52:2664-2681, Oct 1995. [ bib | DOI | http ] |
BSc (Elec Eng) University of Cape Town, HDE University of South Africa
Maths and Science Tutor, Florida Park, Johannesburg
Research areas (personal interest): Hydrogen / Hydrogen-like spectra. Historical Maths.
Wikipdedia contributions: Ptolemy’s Theorem, Diophantus II.VIII, Continuous Repayment Mortgage


Leave a Reply
Want to join the discussion?Feel free to contribute!