Understanding Bohr’s Helium Lines
Table of Contents
Introduction
In a previous article “Calculating the Balmer Alpha Line” we mentioned how accurate predictions of the spectral lines of singly ionized Helium were of considerable importance in persuading the scientific community that Danish physicist Niels Bohr was on the right track in respect of his groundbreaking atomic model first published in 1913. In this model bound electrons emit packets (quanta) of energy when they move from a higher energy state to a lower energy state. Observed spectral lines correspond to specific frequencies of light (or electromagnetic radiation generally) associated with the transition energy between two such states.
The subject matter of this article is once again concerned with aspects of the calculation of such lines noting the differences as compared to calculating corresponding lines of the hydrogen spectrum. To compare calculations against measured wavelengths, we will be using the somewhat understudied 1916 measurement(s) of the Helium spectrum effected by Friedrich Paschen. We will discuss his measurement of the fine structure complex at a wavelength of approximately 4686 Angstroms (468.6 nm) before moving on to examine (from a historical perspective) the various transitions (in singly ionized Helium) from energy levels above those with principal quantum number = 4 down to level 4 – the Pickering Series.
Singly Ionized Helium: 4686 Angstrom Fine Structure Complex
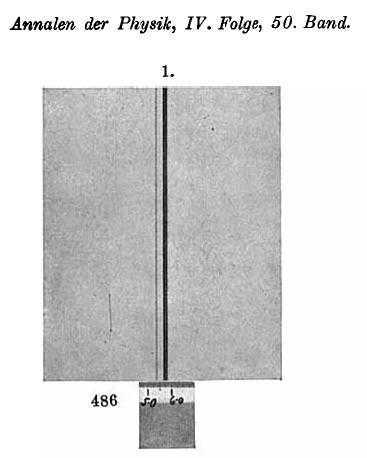
Our first diagram below shows the spectral lines measured by Paschen at approximately 4686 Angstrom (there appears to be a misprint next to the 1-angstrom ruler shown since it should start at 468 – 5 and not 486 – 5). The graphic appears – at first sight – somewhat nondescript. A couple of lines are visible with one being narrow and light, the other much broader and darker. There also appears to be a very faint absorption line (white) a fraction to the left of the broad dark line – perhaps just an artifact of the measurement process. Presuming the plate is a photo negative, the darker line(s) correspond to stronger emission at that particular wavelength.
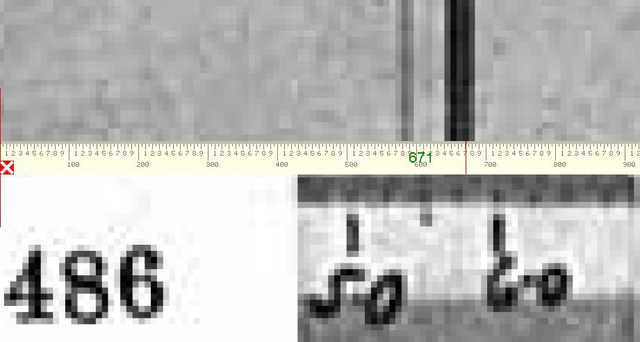
The picture becomes clearer when one ‘zooms in’ somewhat (image below) when the apparent single dark line is shown to consist of two separate – albeit very finely spaced – lines. A super-imposed pixel ruler is shown measuring the position of the second dark line. The 500-pixel mark is set on the 4685 Angstrom ruler mark and there are 212 pixels per angstrom so the reading taken is 4685 + (671-500)/212 = 4685.807 Angstrom. The resolution of this measurement is somewhat poor since it will be seen that at this magnification the printer pixels (dots) are showing and each printer pixel is about 9 screen pixels wide (+- 0.04 Å). It appears that the dark lines are exactly one printer pixel in width – this is artificial and one would need a high-resolution image of Paschen’s original plate to ascertain more exactly the width of the lines as well as wavelengths of line centers. Paschen’s measurement of this line was 4685.803 Angstrom (Ia, IIc in the table of measurements on page 14 [913] of Reference 2 – if we interpret correctly).
Identifying the Lines
From the NIST spectral lines database for He II (400-500 nm), we find that in terms of intensity, the dominant wavelengths in the 4686 Å fine structure complex are theoretically at air wavelengths of 4685.704 Å and 4685,804 Å and we conjecture that these match the 2 thinly separated dark lines shown above. Our somewhat crude pixel ruler-based measurement of the longer (rightmost) wavelength at 4685.807 A is close enough to the second wavelength mentioned above as well as to Paschen’s given value of 4685.803 Å . We conclude that the corresponding line reflects the He II transition 4f 7/2 to 3d 5/2 – the exact transition for which the Dirac energy simplification (referred to in the previous article) is applicable. We can therefore proceed with wavelength calculation using the simplified Dirac energy equation appropriately modified for singly ionized Helium.
Wavelength Calculation
The simplified Dirac energy formula that we have used to calculate the Balmer alpha line of atomic hydrogen is:
$$ E_{n}=\mu c^2\sqrt{1-\frac{Z^2\alpha^2}{n^2}} $$
Singly ionized Helium is a Helium nucleus with one of its two electrons stripped away. Needless to say, such ionization will only take place under extreme conditions which is why the corresponding spectral lines were originally discovered in extremely hot Wolf-Rayet stars. At the time scientists thought they had discovered a mysterious form of hydrogen (proto-hydrogen) for which the spectral lines could fit Balmer’s formula if ‘half integer’ quantum numbers were permitted. For our purposes, singly ionized Helium can be considered “Hydrogen-like” in so far as it is a nucleus with one bound electron obeying the same equations of motion as the single Hydrogen electron. What will change as compared to the Hydrogen Balmer alpha calculation are the following:
- ##\mu## the reduced electron mass since for Helium we have a nucleus with the same mass as an alpha particle
- Z since the atomic number of helium is 2
- transition primary quantum numbers will be 4 and 3 rather than 3 and 2
Hence the formula to be used is as follows:
$$He^{+}_{4f_{7/2}-3d_{5/2}}=E_4-E_3=\mu c^2\left(\sqrt{1-\frac{4\alpha^2}{16}}-\sqrt{1-\frac{4\alpha^2}{9}}\right) $$ where ## \alpha ## is the fine structure constant and ## \mu ## the reduced electron mass for a single electron bound to the Helium nucleus. Reduced mass is calculated as follows from electron mass and alpha particle mass: $$\mu_{He} = \frac{m_e\times m_{alpha}}{m_e+m_{alpha}} $$ Applying the above formula, we obtain the following wavelength corresponding to the singly ionized Helium 4f 7/2 – 3d 5/2 energy level transition: 4687.1154 Å. After carrying out a vacuum-to-air conversion, we obtain a wavelength of 4685.804 Å which is in good agreement with Paschen’s measurement at 4685.803 Å .
A more recent measurement (Kessler 1973) of wavenumber for this transition was ##21335.0846 \pm 0.0023 cm^{-1} ## and the wave number corresponding to the above-calculated wavelength (4687.1154 Å) is ## 21335.0837 cm^{-1} ## which is well within the boundaries set by Kessler’s given error limits. As with the Balmer Alpha line in our previous article, the unerring accuracy of the Dirac energy equation is apparent since the fractional difference between measured and calculated wavenumbers is just 40 ppb (parts per billion). This is substantially less than the fractional uncertainty in the measurement of ## \pm108 ## ppb.
Historical Context of Paschen’s Measurements
An excellent description of the scientific context in which Paschen’s measurements of the Helium spectrum were made is given in Reference 3 (HH Plaskett: 1922) which is commended to the reader’s attention. In respect of this particular article, we quote the following from Plaskett’s paper:
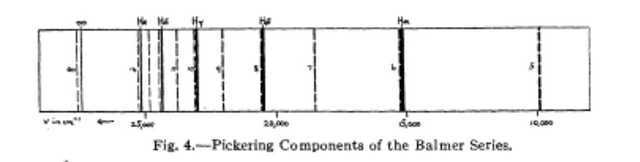
The Pickering series, Bohr found, would be given by a formula of the type ## 4R_H(1/4^2—1/m^2) ## where m=5, 6, 7… This on his theory means that ionized helium atoms in which electrons are falling from outer orbits to the fourth would give rise to the Pickering lines. But as Bohr pointed out m=7, 9, 11… gave in this formula the Pickering lines 5411, 4541, 4200, etc., whilst even values of m gave lines coinciding with the Balmer series. This coincidence is not exact since a refinement of the theory, which takes account of the finite masses of the nuclei and their consequent motion, gives the [wave number] ratio as not exactly 4 but ## 4 \times M_{\alpha}(M_P+m_e)/[M_P(M_{\alpha} +m_e)] = 4.001635 ## where ##M_H## is the mass of hydrogen nucleus and ## M_{\alpha} \approx 4M_P ## is the mass of the helium nucleus. The consequence of this refinement of the Bohr theory is that even values of m in the formula ## 4.001635R_H(1/4^2 – 1/m^2) {\tiny [=4R_{He}(1/4^2 – 1/m^2)]} ## will give lines displaced 1 or 2A to the violet of the Balmer lines. Bohr predicts that, in a star or in a vacuum tube containing hydrogen and helium and under proper conditions of excitation, the resulting spectrum will appear as in Figure 4. The heavy unbroken lines are the first five members of the Balmer series. The dotted lines are the first ten members of the complete Pickering series, even values of m giving, it will be noted, are close companions to the Balmer hydrogen lines. The discovery of such companions to the Balmer series would furnish the strongest evidence that the Pickering series is due to ionized helium, not hydrogen.
Paschen’s measurements were designed to achieve exactly that described in the last sentence above. Once again we can do no better than to quote from Plaskett’s work:
The next attempt was a completely successful one by F. Paschen. He used a special form of helium tube with a “hollow box-shaped cathode”. Within this cathode, when the tube was operated with a continuous current, there appeared a yellow glow. Examined spectroscopically this glow showed the ordinary helium spectrum,
the 4686 series, and the Pickering lines. Under these conditions, the Pickering lines were comparatively sharp. A trace of hydrogen impurity enabled him, with various orders of a small grating spectrograph, to photograph the Balmer lines and their ionized helium components. His measured wavelengths are given in the table. The first column gives the wavelengths of the Balmer series, the second the wavelengths of the complete Pickering series as computed according to Bohr, and the third column contains Paschen’s measured wavelengths. There thus can be no doubt that in the laboratory, Bohr’s prediction, and consequently his theory, is beautifully verified.
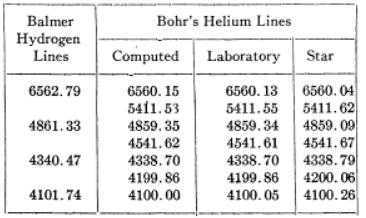
The fourth column of data consists of Pickering series wavelengths measured in stellar spectra as further verification of the laboratory-measured values. Given the small but significant differences, one would be fairly confident that the stellar wavelengths matching Balmer Hydrogen lines are members of the Helium Pickering series rather than Balmer Hydrogen.##^1## One may further note from the table that laboratory-measured helium wavelengths (for even quantum numbers 6,8,10,12) have a consistent ratio of 1:1.0004 to the corresponding Balmer Hydrogen lines(with upper-level quantum numbers 3,4,5,6). This corresponds to the theoretical ratio of electron-reduced mass (Hydrogen) to electron-reduced mass (Helium).
At the same time as “beautifully verifying” Bohr’s theory, Paschen’s measurements highlighted a major problem with it: namely that it was unable to address the problem of fine structure. Despite the values shown in the table above, each line is not a single line but a veritable forest of fine structure lines! That Paschen had noted such is clear: he does not refer (for example) to “line 4686” but rather to “Gruppe 4686”. As we see above, he had managed to resolve and measure certain of the fine structure lines.
Statistical Note
Although the process is somewhat too tedious to detail here (convert air wavelengths to vacuum and then obtain a ‘reciprocal Rydberg’ formula for wavelength rather than wavenumber), one can apply regression statistics to Plaskett’s data set to obtain reasonably accurate values of the Rydberg constant for Hydrogen and Helium. The empirical ratio ##R_{He}:R_H## thus obtained is once again 1.0004:1 in agreement with theory.
Acknowledgments
A special word of thanks to Dr Alexander Kramida and the staff at NIST. They have been enormously helpful and patient despite being peppered incessantly for data on Hydrogen, Deuterium, and Helium spectral lines.
I would also like to thank several PF members – notably DrClaude – who have assisted with various queries I have submitted relating to the material in this article and the previous about the Hydrogen Balmer Alpha line. As well as mfb and Jedishfru who have kindly assisted in reviewing the articles.
Finally, without Greg we would not have had Physics Forums in the first place!
Footnotes
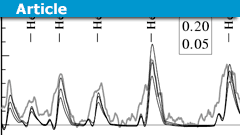
- One must question whether such separation of Balmer and Pickering series lines would be possible in stellar spectra. Here for example is a Hubble Telescope spectrogram of a helium-rich WN 4.5 star in planetary nebula N66. Every other He II line is augmented somewhat by the presence of residual Hydrogen. Image taken from this article.
References
| [1] | A. Kramida, Yu. Ralchenko, J. Reader, and and NIST ASD Team. NIST Atomic Spectra Database (ver. 5.6.1), [Online]. Available: https://physics.nist.gov/asd [2019, August 9]. National Institute of Standards and Technology, Gaithersburg, MD., 2018. |
| [2] | F. Paschen. Bohrs Heliumlinien. Annalen der Physik, 355(16):901-940, Jan 1916. [ DOI ] |
| [3] | H. H. Plaskett. The Pickering Series and Bohr’s Atom. , 16:137, Apr 1922. |
| [4] | E. G. Kessler. Determination of the rydberg constant from the he ii n=3-4 (469-nm) line complex. Phys. Rev. A, 7:408-415, Feb 1973. [ DOI | http ] |
| [5] | Wikipedia contributors. Balmer series – Wikipedia, the free encyclopedia, 2019. [Online; accessed 9-August-2019]. [ http ] |
BSc (Elec Eng) University of Cape Town, HDE University of South Africa
Maths and Science Tutor, Florida Park, Johannesburg
Research areas (personal interest): Hydrogen / Hydrogen-like spectra. Historical Maths.
Wikipdedia contributions: Ptolemy’s Theorem, Diophantus II.VIII, Continuous Repayment Mortgage


Leave a Reply
Want to join the discussion?Feel free to contribute!