LightCone8 Tutorial Part II – Charts
Part I dealt with the basic user interface of LightCone8. This part of the tutorial is about potentially useful cosmological insights to be gained from LightCone8 charts. As a first example, we will find the answer to a common question: when did cosmic expansion change over from decelerating to accelerating? We could have jumped into the math and solved a few equations, but a relatively small number of clicks in LightCone8 can give us a very good answer in a jiffy.
Table of Contents
2.1 A Chart as a Quick Solution
Open the calculator and leave all the inputs at default values. Under <Output Scaling> tick: <Billion years> and under <Display as:> tick <Chart>. Then click: <Open Chart Options> and just change <Vert Max> to 2.0. Click: <Close Chart Options> to get it out of the way and then click: <Open Column Definition and Selection>. In the right-hand bottom corner of the selection box, click <None> and then tick three of the red crosses in the column boxes, namely: <Time>, <Scale factor (a)> and <Vgen>. Then click <Calculate> and you should get the chart below.
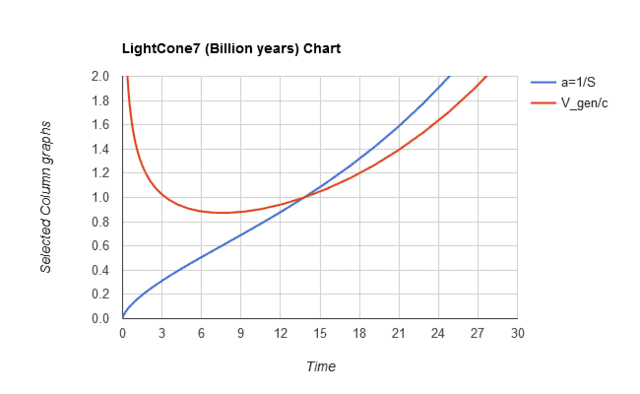
Chart 2.1 Scale factor (blue) and Recession rate (red) against Cosmological Time
The blue curve is the scale factor over time and the red curve is a scaled version of the slope of that curve. It is labeled <V_gen> (generic), because it happens to be the recession rate of any galaxy that is presently exactly on our Hubble radius. The inflection point of the scale factor curve, from concave to convex, will coincide with the minimum point of the V_generic curve. The latter is the easiest to judge from the curves, occurring around the time 7.5 Gy, which is perhaps good enough for all practical purposes.
But, suppose that for academic reasons, we want to be somewhat more precise. The answer lurks in the tables, but we must first set the table ranges to suit our requirements. You can play around, but here are the quick steps to the solution: since the inflection point lies between scale factor a=0.5 and a=0.7 and since S=1/a, one should set the S-range to S_upper =2 and S_lower = 1.5. To find an accurate minimum point, also click <Open Column Definition and Selection> and set the number of decimals of V_gen to the maximum, which is 9. Lastly, set the <Output As:> to <Standard> and then <Calculate>.
Look about two-thirds down the table to a = 0.605, where V_gen/c reaches a minimum value of 0.872581279 and the corresponding time is T=7.579374 Gy. This is obviously absurdly over-precise, but it serves to illustrate the point of finding a minimum or maximum value.
2.2 Charts can Demystify
A question that is often asked: why is it possible to observe the most distant galaxies, while it is said that they were receding from us much faster than the speed of light when the light that we now observe had left them? For this, we need a chart of the past light cone, which the LightCone7 calculator calls <D_then>. It is the proper distance of an observed object at the time when the photons were emitted.
Together with D_then, we need another crucial parameter, the Hubble radius at the time of the photon emission, referred to simply as R in LightCone7 jargon. For this chart, we have selected the two applicable curves (as before) and then set both <Vert max> and <Hor max> to 15, with <Hor marks> at 16.
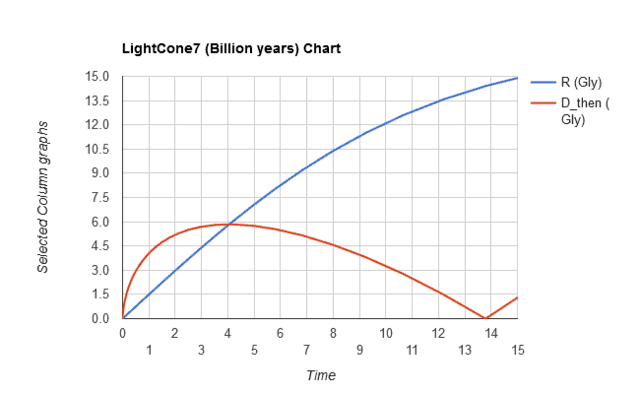
Chart 2.2 Past Light cone (red) and Hubble radius (blue) against Cosmological Time
The blue curve shows how the Hubble radius has grown over time, pretty much linearly in the beginning, before flattening out under the influence of the cosmological constant. The red half-teardrop of the (past) cosmological light cone needs to be rotated around the horizontal axis to form a complete light cone in two space and one time dimensions.
For the first four billion years, the expansion rate was so large that photons from distant sources, propagating at c, could not make any headway in our direction; instead, the proper distance to these photons has been growing. Two related things stopped that from continuing: firstly, due to the gravity of matter and radiation, the expansion rate dropped rather rapidly; secondly, this caused the Hubble radius to increase at a rate of about 1.5 light-years per year (essentially 1.5c).[1] Around 4 billion years, the two curves crossed and from then on those photons could actually make headway in our direction.
Actually, when the CMB photons that we now observe were released, their proper distance from us grew at a whopping 65 light-years per year (essentially 65c). Around time 4 billion years, the proper distance of those photons was momentarily ‘static’ relative to us, because they were crossing our Hubble sphere.
At the Hubble radius, the recession rate of comoving objects equals c and that canceled the closing speed of those photons. However, the Hubble radius was still increasing and soon the photons were inside that radius.
2.3 Charts can ‘De-confuse’
We often read in popular articles that the expansion rate is given by the Hubble constant today and that the Hubble constant is actually decreasing. Then we also read that the expansion is presently accelerating, conjuring up images of an increase in the expansion rate. Confusing! To help us understand, we reproduce chart 2.2, but with scaling this time set to <Normalized> and with the addition of the Hubble value <H/Ho>.
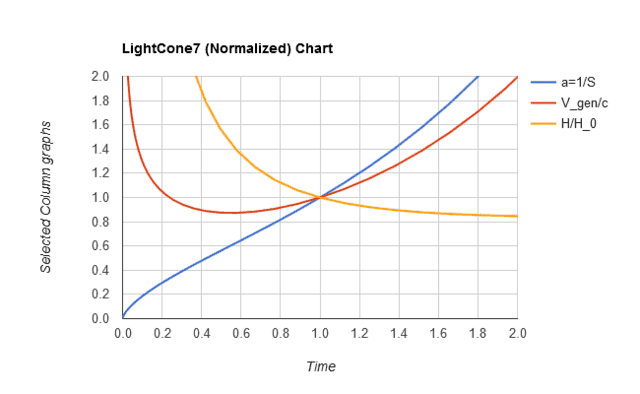
Chart 2.3 Expansion rate (gold) and Recession rate (red) compared
The gold curve is the normalized Hubble value as it changes over time. It is the real ‘expansion rate’, because it operates just like compounded interest at your bank, albeit originally at a sharply declining interest rate. The present ‘best-fit’ value of the Hubble constant is about 68 km/s per Mpc (comoving distance), which is relatively easily converted into a rate of 1/144 % per million years. Note the correspondence to the way normal interest rates are specified, i.e. a % per year, which can also be stated as so many dollars per year per 100 dollars invested. This is the ‘expansion rate’ of your money.
Constant interest rate investments give ‘accelerated’ growth, due to the ‘interest on interest’ effect. More dollars are added to your investment every year. That is unless the interest rate drops very fast. This is exactly what happened during the first 7.5 billion years (T=0.55 normalized); the expansion rate dropped faster than what the ‘compounding’ effect on the scale factor could counter.
Then two things contributed to a change to this state of affairs. Firstly, as the matter became (on average) less dense and the cosmological constant started to contribute more significantly,[2] the slowing down of the expansion rate slackened. Secondly, the larger the scale factor became, the more actual growth there was.
At some point, the compounded growth started to win over the decreasing expansion rate and from then on we had accelerated expansion. The actual growth corresponds to the recession rate of any given galaxy, e.g. the ‘generic galaxy’, depicted by the red curve. A constant expansion rate gives an exponential growth rate, just like a constant interest rate (compounded), which gives an exponential growth in any investment.
Hopefully, it is no longer too confusing…
2.4 More Charts
LightCone8 sports a whole host of curve types at various scale options. Feel free to experiment and ask questions in the comments section. You can also use the charts or tables freely in PF posts or other Blogs.[3]
In the Part III, the math used in Lightcone8 will be briefly discusses.
–0–
End-notes
[1] For the first few thousand years, radiation dominated the energy density and the Hubble radius grew at 2 light-years per year (essentially 2c). The above chart’s scale does not make this visible, but anyone who wants to check it out graphically, can set up a chart like this: <S_upper>=20000 (the max for this calculator, but well inside the radiation era), <S_lower=100> (well after the CMB emission). Select <Billion years> and <Chart> in the yellow boxes. Under <Open Column Selection> choose only <Time> and <Hubble radius>. Finally, under <Chart Options>, set <Vert max> to 0.001 and <Hor max> to 0.0005. You can check that the slope of the curve is close to 2. It is actually not straight, because radiation/matter density equality happens more or less in the center of the curve (around 50 thousand years).
[2] The cosmological constant represents the simplest form of ‘dark energy’, where the effective energy density is constant over space and time. It is not yet certain if this holds precisely, but the LightCone7 calculator assumes that it does.
[3] There is presently some incompatibility between the Google Chart function used in Lightcone8 and Microsoft’s Internet Explorer (IE) browser. The charts are produced in IE, but there is a problem with the clipping of the curves at the edges of the grid selected in Chart Options. The charts work correctly in the Firefox (FF) and Google Chrome browsers. If you are running this forum in IE, we suggest that you open Lightcone8 in a separate window or tab, using FF or Chrome. Copy and paste this URL directly into the browser: https://light-cone-calc.github.io/
Male aerospace engineer
Play music, Read relativity and cosmology


There is an issue under investigation with the LightCone7 charts and Internet Explorer. The charts are produced without any clipping of the curves where they fall outside of the selected axes limits, giving a messy look. This does not happen in either Mozilla Firefox or Google Chrome, so it may be a HTML or Java script interpretation problem in the IE browser. For IE users, and until this is resolved, I recommend a workaround of opening a separate window in FF (or Chrome) and then opening LightCone7Combo in there.
“Very difficult to get an intuitive view of all these interactive parameters, even with all those graphics.”
Since this is a tutorial, it is the right place to ask for clarifications, not only about the calculator, but also about the parameters and results.
Very difficult to get an intuitive view of all these interactive parameters, even with all those graphics.No wonder common sense discussions about expansion are always off the mark, and arguments over arguments lead nowhere.