LightCone8 Tutorial Part I
LightCone 8 is a versatile tabulating/charting cosmological calculator, useful for understanding the expansion history of the universe (and even some future expansion), based upon the Lambda-Cold-Dark-Matter (LCDM) model. Part I of this mini-series gives a broad overview of the user interface and the main functions. Follow-on parts will highlight some specific uses and techniques.
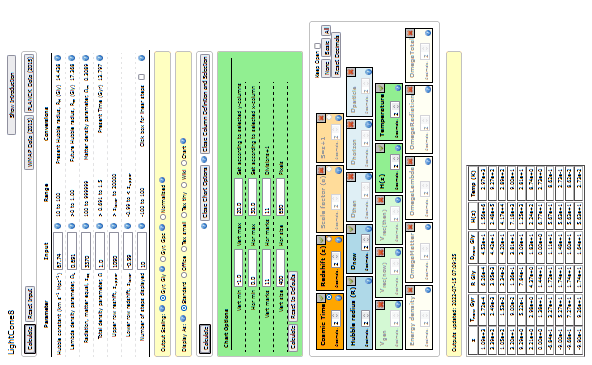
Table of Contents
1.1 Model Introduction
The cosmic expansion history is normally calculated against the cosmological scale factor a. The scale factor is chosen so that a=1 denotes the present scale and a=0.5 the stage when the distance to a specific galaxy or cluster was half of its present distance. In the same way, a=2 refers to a future stage when that distance will be twice what it is now.
It is often more convenient to use the redshift, z=1/a – 1, because it is what is observed and is often quoted in the literature. This calculator originally used a “stretch factor” (S=z+1), but it has now been reformatted to take redshift as part of the inputs. It still uses S in the calculations in some places.
1.2 The Calculator
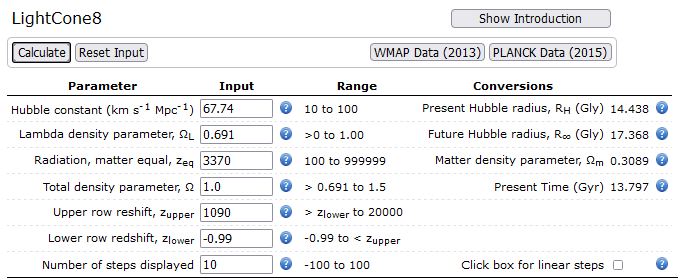
At the top-left of the calculator’s user interface, there are seven input parameters that can be manipulated in order to set the basic parameters of the calculation. The quantities listed on their right are derived from those inputs as an aid in comparing them with standard published values. When it opens for the first time in a session, the calculator will automatically display the default inputs and a table with some output columns for a wide redshift range. Actually, this range stretches from the time of the cosmic microwave background (CMB), all the way to some 80 billion years into the future. The range can be set to anywhere within the limits indicated. The default values come from the Planck mission’s 2015 data release.
1.3 The 7 inputs and default values
The WMAP and PLANCK mission input buttons give a quick way to compare the two sets of data analysis outputs. If you open the calculator you will see that they are very close to each other, signifying a convergence of cosmological observational data. The following is a description of the values in the input panel.
1) Hubble Constant: The conventional Hubble constant is given as the recession rate of a hypothetical galaxy at exactly one Mega-parsec (Mpc) comoving distance.
2) Lambda density parameter: This is the energy density equivalent of the cosmological constant, Lambda. It is given as a fraction of the critical density that would make the universe spatially flat.
3) The epoch of radiation-matter equality: default zeq. The early universe was dominated by radiation energy, but because expansion ‘stretched’ the radiation wavelengths, the energy density of radiation reduced more rapidly than the energy density of matter. So there came a time when they were equal, after which matter dominated. Matter domination then lasted for almost half of the present cosmic time, being eventually overhauled by the cosmological constant.
4) Total density parameter: default Omega = 1. This option allows one to adjust the spatial curvature to some extent. The default value of O=1 represents a flat spatial geometry (which seems to be the most likely case for our universe); O >1 represents a positively curved (closed) spatial geometry and O < 1 a negatively curved (open) spatial geometry.
5) Upper row redshift: The default corresponds to the CMB. It determines the redshift of the top of the output table. You can select any value within the range indicated.
6) Lower row redshift (default z = -0.99). It determines the redshift of the bottom of the output table. S=0.01 translates to some 80 billion years into the future. Again, you can select any value within the range indicated.
7) Number of steps: default zsteps=10, just giving an initial overview table with 10 to 12 rows. Select within the limits. For charting options, the calculator automatically increases the number of steps to 100 for smooth curves.
For all inputs, more information is available under the ?-tooltip or hover-bullets.
1.4 The Output Scaling and Display Options
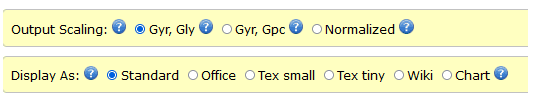
Although the units (or scaling) of individual columns are not variable, a number of overall scales selections are available, namely: billion years/light-years; billion years/Gigaparsec; normalized around the present values. See the tooltip bullets for more guidance.
In the Display As block you will see 7
options. Consult the blue dot tooltips for additional information on these. To summarize:
Standard gives the normal table format.
Office gives a copy and paste-ready version for Microsoft Office documents. Just press CRTL-c or right-click and select Copy.
Tex small gives a copy and paste-ready LaTex version of the table which, despite its name, may be larger than you want.
Tex script gives a LaTex version which has so far been found to be a fitting size for many Forum applications (including PhysicsForums).
Wikidot gives a copy and paste-ready Wiki-HTML table for sites that recognize that format.
Chart allows one to graph the tabulated results. The horizontal axis and the other columns selected for the table are represented as curves. See “Column Definition and Selection” below.
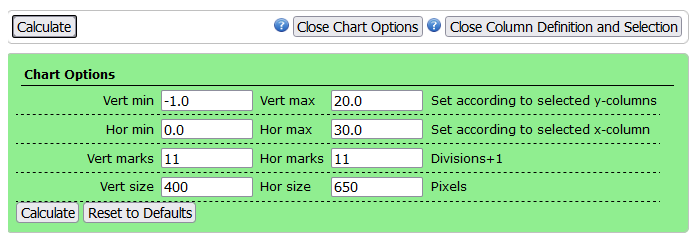
1.6 The Chart Options Block
This block is fairly self-explanatory, but in short, it allows you to plot all the columns selected, with the one selected with the radio button in the top row of Column Selection as the horizontal axis. It automatically adjusts the default chart scale according to the scaling selected for the tables. You can however set it for any scale you desire. The horizontal and vertical marks set the number of divisions on the axes – this allows for useful values along the axes.
1.7 The Column Definition and Selection Block
This lets you choose the quantities (time, distance, recession speed, etc.) that you want to be presented in the columns of the table, at the desired degree of decimal-place precision. Each column listed on the block has a place to check if you want it included, or to uncheck if you wish to exclude it. The blue dot tooltips explain how the columns are defined and can help you understand the table. The small round radio buttons in the top row allow one of them to be designated as the horizontal axis for the Chart options. There are currently 18 columns to choose from, of which only a selection is shown below.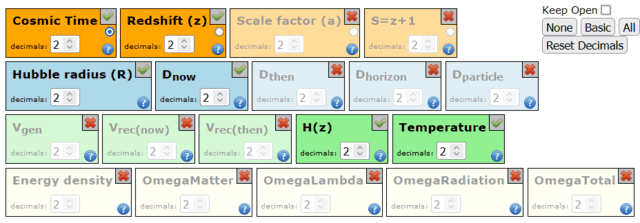
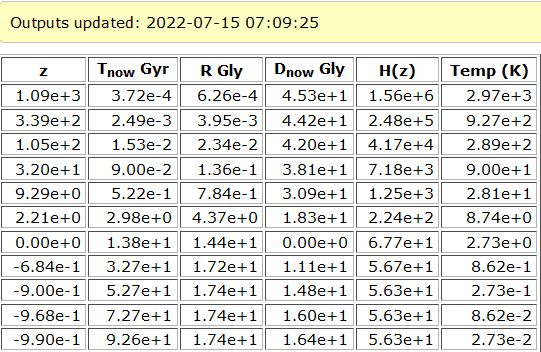
1.8 The Outputs
Each row of the table gives information (time, distances, recession rates) about a given stage of expansion. E.g. if we are observing light from a galaxy that was emitted back at z=2.2, the corresponding row of the table will tell us the cosmic time of the light emission (T~3.29 Gy), the Hubble radius at the time (R~ 4.37 Gly), the galaxy’s present and past distances (18.2 and 5.7 Gly respectively). Plus any of the other items in the Column Selection block, as selected.
1.9 There is more…
The main equations used in the calculations will be presented in a later part of this series. In the Part II, we will examine the charting options in more detail. It has proven to be a valuable starting point for a general understanding of the standard model without needing any math.
Male aerospace engineer
Play music, Read relativity and cosmology


It was surely fun to develop the tool with all the participation and comments on this forum. :smile:
The future? Well, the present concept is nearing the limits of what the present implementation scheme can handle. A few tweaks and a few more columns will be about it. Major new requirements may require a total revamp of the “engine” and user interface of the calculator. So we will have to wait and see…
Thanks Jorrie! I think this has been a really great project and it's been fun to watch it develop. What will future updates bring us?