
Intro to Physically Reasonable Waves on a String
Table of Contents
Introduction
Physics teachers who are either writing physics questions that deal with waves on a string or setting up equipment for a class lab or demo of standing waves on a string might find the following analysis useful. When writing questions for physics tests or homework, it is preferable to use physically plausible values for any quantities (Ref. 1). With that in mind, let us explore what physically limits quantities such as wave speed or string tension in a typical standing-wave setup for a school physics lab.
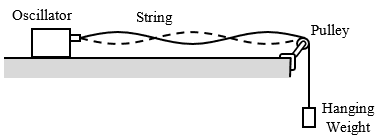
The above figure shows a typical standing-wave setup. An oscillator at one end of a string vibrates vertically to produce waves along the string, while the weight hanging at the other end holds the string taut. A pulley confines the waves to the horizontal section of the string while still allowing the force exerted by the weight to hold the string taught.
The following quantities come into play when analyzing a standing-wave setup for a string.
- v, the wave speed
- f, the wave frequency
- ## \lambda ##, the wavelength
- L, the length of the string
- ## \mu, ## the linear mass density (mass per unit length) of the string
- T, the tension in the string
One way to visualize the relations among these quantities is on a plot of v vs. L. Also, it is helpful to use a log scale for both quantities. Why a log scale? As we’ll see, various physical constraints result in power-law relations between v and L. By using log scales, these relations can be represented by straight lines. Moreover, using log scales allows a diagram to display values that cover several orders of magnitude.
Alternatively, relations that represent the same physical constraints can be depicted on a diagram of the fundamental frequency ##f_1## (rather than v) vs. L. Diagrams of both v vs. L and ##f_1## vs. L appear later in this article.
Five Physical Constraints
We’ll look at five physical constraints that, taken together, will limit the allowed combinations of wave speed and a string length to a five-sided region on the v-L diagram. The constraints are:
- ##f_1,## the maximum frequency of the fundamental mode
- ##L_\rm{max},## the maximum string length
- ##L_\rm{min},## the minimum string length
- ##T_\rm{max},## the maximum tension in the string
- ##T_\rm{min},## the minimum tension in the string
As we shall see, these conditions can be represented by straight lines on the v-L diagram.
Constraint 1: The maximum frequency of the fundamental mode
This might simply be the maximum frequency of the oscillator that generates the waves. However, if a physics class setup is to demonstrate higher-frequency harmonics in addition to the fundamental, then the fundamental will necessarily have to be several times lower than the maximum oscillator frequency. As an example, we’ll use 100 Hz for ##f_1##, so that several harmonics can be produced by frequencies up to several hundred Hz.
To represent our choice of ##f_1## on the v-L diagram, we combine the relations ##\lambda_1 = 2L## (the wavelength of the fundamental mode) and ##v = f_1 \lambda_1## to get $$ v = 2 f_1 L ~.$$
For our example where ##f_1 = 100~\rm{Hz},## this becomes
$$v = (200~\rm{s^{-1}}) L~.$$
Constraints 2 and 3: The maximum and minimum string lengths
In our example, we’ll take 3 m and 0.3 m, respectively, for the maximum and minimum lengths. A string length of around 1 m is typical of these setups. We’ll then use a factor of three higher and lower than 1 m for our “allowed” range. A single demo might use a string up to 3 m long for viewing by an entire physics class, while 10 to 15 separate lab groups working with separate setups would most likely use shorter strings of 1 m or less. However, if the string is too short the movement of the contact point between the string and pulley will become significant compared to the string length.
On the v-L diagram, these two constraints are represented by vertical lines at the maximum and minimum string lengths.
Constraint 4: The maximum tension in the string
The maximum tension is the greatest force that can be safely applied to the string. We might start with the tensile strength of the string material, and then reduce that by a suitable safety factor. To apply this to a nylon string, for example, we could take 1/3 of the 82 MPa tensile strength (Ref. 2). This gives maximum stress of ##\sigma_{\rm{max}} = 27~\rm{MPa},## which is related to the maximum tension ##T_{\rm{max}}## and the cross-sectional area ##A## of the string via ##\sigma_{\rm{max}} = T_{\rm{max}}/A~.##
This results in a maximum string speed ##v_{\rm{max}} = \sqrt{\frac{T_{\rm{max}}}{\mu}} = \sqrt{\frac{T_{\rm{max}}/A}{\mu/A}} = \sqrt{\frac{\sigma_{\rm{max}}}{\rho}}~,## where ##\rho## is the density of the string material. The maximum speed depends entirely on the string material and is independent of its diameter or length.
On the v-L diagram, this constraint is represented by a horizontal line at ##v=v_{\rm{max}}=\sqrt{\frac{\sigma_{\rm{max}}}{\rho}}~.##
Taking nylon as an example, using values of ##\sigma_{\rm{max}} = 27~\rm{MPa}## and ##\rho=1150~\rm{kg/m^3}## (Ref. 2) results in ##v_{\rm{max}}=150~\rm{m/s}~.##
Constraint 5: The minimum tension in the string
(Relating the minimum string tension to a wave speed constraint is a bit involved, so this section is longer than the previous ones.)
It may not be obvious that there would be a minimum string tension, but at first glance, it makes sense that the tension should be high enough to ensure that the string is “pulled taut”, i.e. the string does not sag.
If we take “pulled taut” to mean that the string makes a straight, horizontal line, then an infinite amount of tension is required! Any finite tension will result in some amount of sag, and we must decide how much sag is acceptable. In this example, we’ll say that the middle of the string can sag by no more than 1% of the total string length.
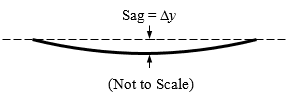
Strictly speaking, the string forms a catenary curve when it is at rest, as shown above. However, for small amounts of sag, a parabola is a good approximation to the string’s shape. We take ##y=ax^2## as the equation of this parabola, with ##x=0## at the center of the string. Note that the sag in the string is ##\Delta y=a(L/2)^2,## since the two strings end at ##x=\pm L/2## are higher than the string’s center by this amount. This gives a fractional sag ##\delta=\frac{\Delta y}{L} = aL/4~.## Evidently the parameter a is equal to ##4\delta/L,## and we can write $$y=(4\delta / L)x^2~.$$ For a maximal sag of 1% ##(\delta=0.01),## we then get $$y=(0.04 / L) x^2~.$$
The figure below shows the forces acting on the string when it is at rest. Included are the tension forces, resolved into horizontal and vertical components, acting on each end of the string, as well as the downward gravitational force.
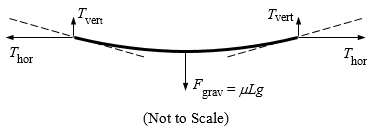
The weight of the string and the two vertical forces ##T_\rm{vert}## balance each other, so ##T_{\rm{vert}} = (1/2)\mu L g~.##
Since the tension force acts along the string, the ratio of the vertical and horizontal tension components must equal the slope of the string: ##T_\rm{vert}/T_\rm{hor} = \frac{dy}{dx}|_{x=L/2} = aL = 4\delta~.## ##T_\rm{hor}## is approximately equal to the tension T, since the string is nearly horizontal (##\delta## and ##T_\rm{vert}/T_\rm{hor}## are much less than 1.) We can then write
$$T_\rm{vert} = 4 \delta T = 0.5 \mu L g $$
$$T_\rm{min}/\mu = L g / (8 \delta)$$
$$v = \sqrt{T_\rm{min}/\mu} = \sqrt{\frac{Lg}{8\delta}}$$
On the log-log v-L diagram, the equation ##v = \sqrt{Lg / (8\delta)}## is a straight line of slope 1/2.
Taking ##\delta = 0.01## (sag is 1% of the string length L), we get
$$v = \sqrt{(122~\rm{m/s^2})L} = (11~\rm{m/s}) \sqrt{\frac{L}{1~\rm{m}}}$$
The v-L Diagram
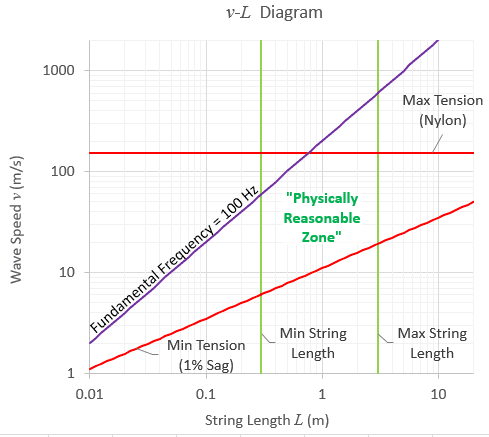
The figure below shows the 5 constraints plotted on a diagram of ##v## vs. ##L## for a nylon string with a minimum sag of 1%. Values of ##v## and ##L## that meet all 5 constraints lie within the five-sided “Physically Reasonable Zone” in the diagram.
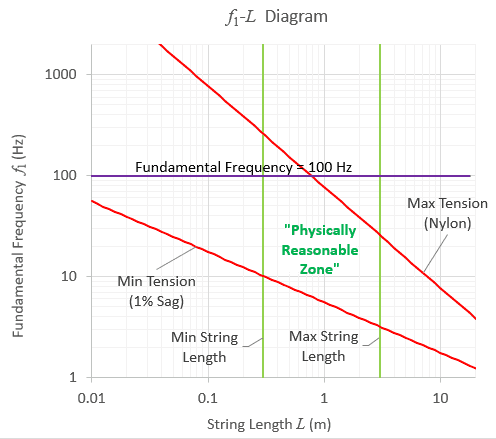
The f1-L Diagram
Knowing the values of physically reasonable wave speeds can be useful for writing physics questions. On the other hand, to set up an actual standing wave demo it may be more useful to think in terms of the fundamental frequency ##f_1## rather than the wave speed.
The constraint equations can be modified by substituting ##(2L)f_1## for ##v##. (##2L## is the wavelength of the fundamental mode.) Solving the resulting equations for ##f_1## then gives new constraint equations, which are plotted in the diagram shown below. Again, this diagram is for a nylon string with a maximum sag of 1%.
Final Remarks
It can be instructive to think about the implications of parameters that lie outside the physically reasonable zone.
For example, if a physics question mentions that a wave on a string has a speed of 1 m/s, this would require that either a large amount of sag is present, the string is significantly shorter than 1 cm, or perhaps the string is in a low-g environment such as that aboard an orbiting space station. Most likely, the question author did not consider the implications of such a slow wave speed. Typically, wave speeds on a string do not get much lower than about 5 or 6 m/s. This corresponds to the intersection point of the “Min String Length” and “Min Tension” lines on the v-L diagram.
Waves speed greater than 150 m/s can be achieved by using materials other than nylon. For example, the waves on the E-string of a violin have a speed of about 440 m/s. A diagram for a violin E-string would have the “Max Tension” line shifted upward relative to the diagrams for nylon shown here.
The minimum tension required to keep the sag at 1% can exceed the maximum tension for sufficiently long strings. This occurs where the two red lines (“Max Tension” and “Min Tension”) in the above diagrams intersect. Strings this long — significantly longer than 10 m — must therefore have a greater amount of sag, while the shorter strings used in typical classroom demos do not run into this issue.
References
1. Morse, Robert A., “Get Real! — Physically Reasonable Values for Teaching Electrostatics”, The Physics Teacher 54, 200 (2016)
2. Laird Plastics website, data for Nylon 101
[Edit 19 Dec. 2020] The above link to Laird Plastics seems to be broken currently, as is their main page. I’m not sure if this is permanent or temporary, but here are two other links for nylon properties:
Lehigh Valley Plastics (pdf file for Nylon 101 properties)
Emco Industrial Plastic (in the Technical Information section, click “Properties”)
Educational Background: PhD | Degree in: Physics | School: University S.U.N.Y at Stony Brook | Occupation: Physics Education


”
(Not sure if you didn’t see the diagrams, or did see them and something still isn’t clear about them
”
Ah yes – I see where you’re coming from. now. Choosing suitable ranges of variables to present to students for practical exercises can be approached in two ways. you either tell them to look between specified limits or you tell them to find those limits. Personally, I always found it difficult to find students with enough confidence to do the latter. They always wanted guidance and we seldom had time to do any more than the basic experiment, followed by the customary graph and analysis. I sometimes wonder if it had anything to do with the religious basis on which the School was run – but that could be just me offloading some of my own guilt.
Afair, there were only one or two opportunities for extended investigations and there would only be the occasional student who would actually risk writing their own agenda. When that occurs, of course, it’s great.
Spotting where the experiment breaks down – where the graph leaves the straight line, for instance is good for qualitative comments.
Earlier in life, as a Research Engineer, I was always coming across this sort of thing but I think experiments would have been run, using ranges of variables that were realistic, found during the experiment on an iterative basis (seat of pants, you could say).
Oh, cool setup!
”
I’m not sure what you mean by that expression …
”
I was referring to the two diagrams toward the of the article — to see them, you’d need to click the “Continue reading” link. (Not sure if you didn’t see the diagrams, or did see them and something still isn’t clear about them.)
”
if your setup was outside what I’m calling the “physically reasonable zone”.
”
I’m not sure what you mean by that expression, exactly but I have used an alternative method which might interest you. The method involves electromagnetic force. A nice beefy horseshoe magnet is placed with a stretched steel wire held between the poles. One end is fixed and the other is tensioned with a variable mass. A fairly powerful signal generator is connected across the ends of the wire. Not directly on the wire but to the fixing and pulley so that the excitation is ‘clean’ and can be applied at any point along the wire. I prefer this method because, unlike when the end of the string is moved, the precise wavelength can be measured because true Nodes can be seen at each end.
Good magnets are easily obtainable these days – much better ones than what I had available a few years ago and a standard School Oscillator will give you frequencies from a few Hz to a few tens of Hz.
Give it a go.
I’m particularly interested in hearing from physics teachers or students who have used these setups, especially if your setup was outside what I’m calling the “physically reasonable zone”.