Learn About Spacetime Diagrams of Light Clocks
We demonstrate a method for constructing spacetime diagrams for special relativity on graph paper that has been rotated by 45 degrees. Many quantitative results can be read off a spacetime diagram simply by counting boxes, with very little algebra—I like to describe this as a method for doing “visual calculations” in relativity. The details are presented in my recent paper (“Relativity on Rotated Graph Paper”, Am. J. Phys. 84, 344 (2016); http://dx.doi.org/10.1119/1.4943251 ). This Insight provides an overview of the idea.
Table of Contents
The Spacetime Diagram
The spacetime diagram (“a position vs time graph”) is a valuable tool for modeling and interpreting situations in relativity. As I like to say, “A spacetime diagram is worth a thousand words.” Many problems and “apparent paradoxes” (or better “puzzles”) can be resolved by drawing a good spacetime diagram. However, because Minkowski spacetime geometry is not Euclidean, there is a hurdle to interpreting the spacetime diagram. As Alfred Schild eloquently stated,
“When it comes to metrical concepts, our Euclidean intuition is no longer valid in space-time—it cannot be trusted. Here we have to re-educate our intuition and learn to think in terms of new pictures. Thus, equal lengths in Minkowski geometry will not look equal, right angles will not look like right angles.”
(Side comment: Before we get into special relativity, it is worth noting that PHY 101’s “position vs time graph” also has an underlying geometry that is not Euclidean. However, practically everybody has learned to read the position-vs-time graph—without knowing anything about this geometry. To help students better understand special relativity, we may have to become more aware of this geometry… but that’s a story for another day.)
Where are the tickmarks?
Although we may be given the tickmarks of the inertial observer drawing the spacetime diagram, a common question is “how does one know where to mark off the ticks of another observer’s clock and meterstick?” More precisely, “given a standard of time marked on an observer’s worldline, how does one calibrate the same standard on the other observer’s worldline?”
Traditionally, this is answered algebraically using the Lorentz Transformation formulas… which is rather abstract for a novice. Geometrically, one may use two-observer diagrams or hyperbolic graph paper—which are rather restrictive. [We use the usual conventions where the time axis is vertical and where the units are chosen so that light signals are drawn at 45 degrees.] The two-observer diagram can only accommodate two frames of reference, and the diagram must be prepared for the velocity of the “moving” frame (here, ##v_{Bob}=3/5##). The hyperbolic graph paper can handle more general velocities but distinguishes the meeting event at the “origin”. For simple problems, either of these is probably sufficient. But what features are they emphasizing? Are these unnecessarily complicated? Unnecessarily expensive?
We propose a new type of graph paper—actually, a new use of plain old graph paper:
Rotated Graph Paper.
The grid lines are aligned with the light cones in spacetime. So, light signals are easier to draw.
But how do we get the 4 ticks along Bob’s worldline that we get from the other graph papers? The paper uses a physical argument based on the Doppler Effect and Bondi’s k-calculus. Here, we will use a geometrical argument (also found in the paper).
Diagramming Alice’s ticking Light Clock with “Clock Diamonds”
We begin the construction by interpreting the unit boxes in the rotated grid. Consider an inertial observer, Alice, at rest in her reference frame, carrying a mirror a constant distance away. Alice emits a light flash (traveling with speed c) that reflects off the distant mirror and returns (at speed c) to her after a round-trip elapsed time. If this returning light flash is immediately reflected back, this functions like a clock, called the light clock.
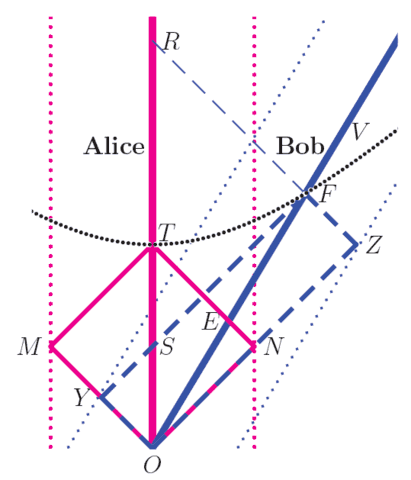
On the rotated grid, we draw the spacetime diagram of Alice and two such mirrors, one to the right (the direction in which Alice faces) and the other to the left. The parallelogram OMTN represents one tick of Alice’s longitudinal light clock, where the spatial trajectories of the light signals are parallel to the direction of relative motion. Henceforth, we will refer to this parallelogram as Alice’s “clock diamond.”
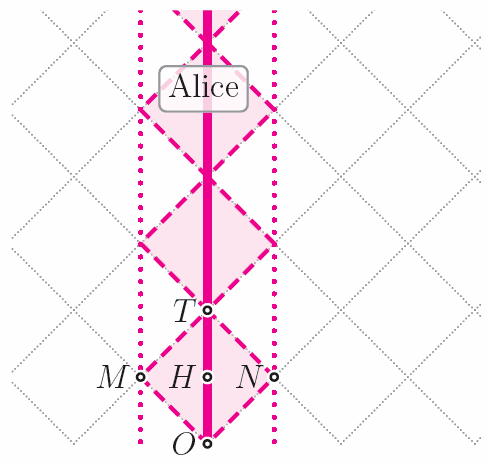
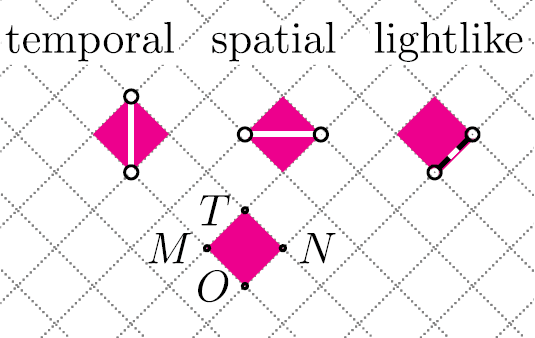
By tiling spacetime with copies of her clock diamond, Alice sets up a coordinate system. She measures displacements in time along a parallel to her worldline (along with diagonal OT, which happens to be vertical on our rotated grid). She measures displacements in space along her “line of constant time” (parallel to diagonal MN, which happens to be horizontal on our rotated grid). According to Alice, events, M and N are simultaneous. Lightlike displacements are measured parallel to the edges of her clock diamond.
Building Bob’s Clock Diamonds
Now consider another inertial observer Bob. For convenience, suppose ##v_{Bob}=3/5##.
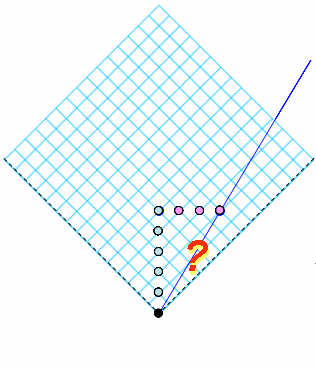
How should Bob’s light clock and clock diamonds be drawn?
This is the Calibration Problem.
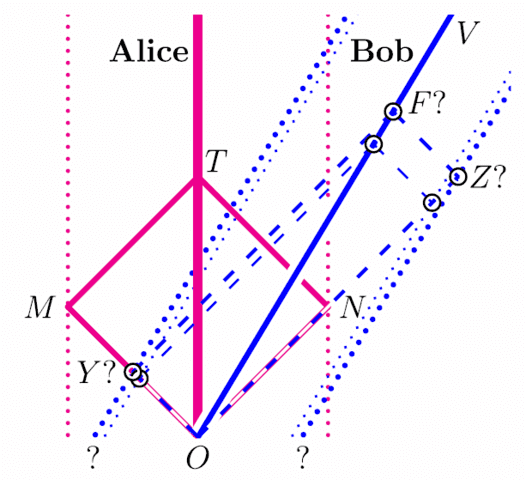
Given Alice’s worldline and one tick of Alice’s clock (clock diamond OMTN), how should one draw event F on Bob’s worldline so that timelike segment OF corresponds to one tick on Bob’s clock (clock diamond OYFZ)?
It turns out that
Bob’s clock diamond OYFZ
has the same area as
Alice’s clock diamond OMTN.
Geometrically, this is because events T and F lie on a hyperbola centered at O with asymptotes along the light cone of O. (Refer to the paper for physical arguments based on the Doppler Effect and Bondi’s k-calculus.)
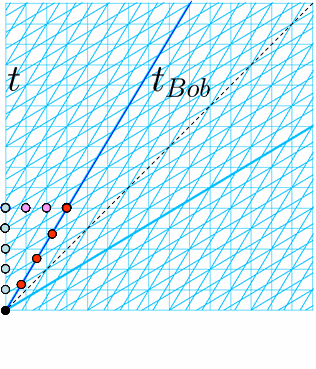
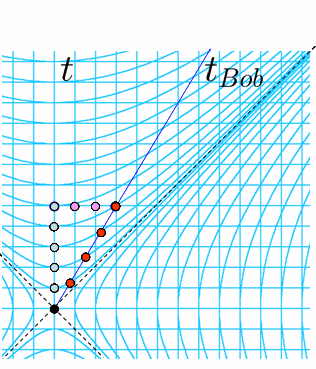
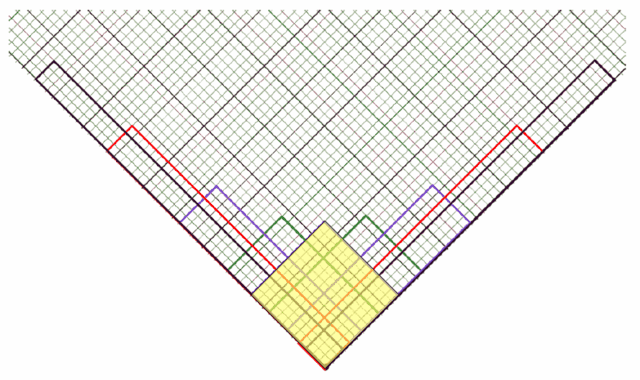
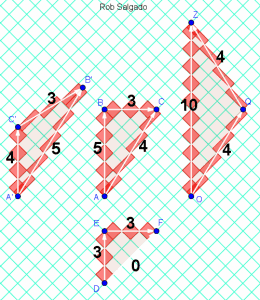
By subdividing the grid (into, say, a 6 x 6 subgrid) and drawing analogous clock diamonds with the same area, you can glimpse the unit hyperbola.
The velocity of a clock in this spacetime diagram is encoded by the width-to-height “aspect ratio” of its clock diamond. So, for Bob, we have:
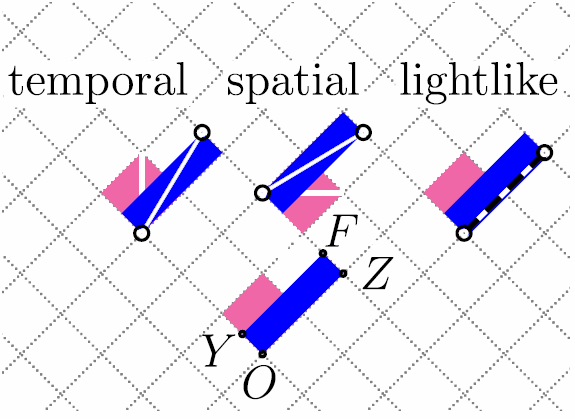
Note that events Y and Z of Bob’s clock diamond OYFZ are simultaneous for Bob—but not for Alice. This is the “relativity of simultaneity.” In the geometry of the spacetime diagram, diagonal YZ is [spacetime-]perpendicular to diagonal OF, even though it may not look so to a Euclidean eye.
Visualizing Time Dilation and the Clock Effect (Twin Paradox)
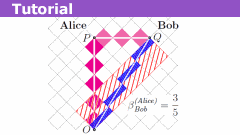
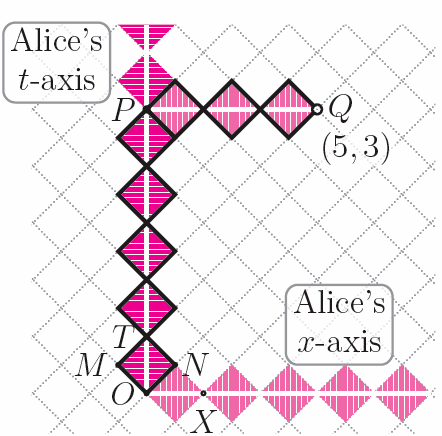
With Bob’s clock diamonds determined, we can now construct the 4 ticks along Bob’s worldline that one obtains in the two-observer graph paper and hyperbolic graph paper. This triangle visualizes “time dilation”: Bob determines the elapsed time from O to Q (events on his worldline) to be 4 ticks, whereas Alice determines the elapsed time from O to distant event Q (Q, not on her worldline) to be 5 ticks.
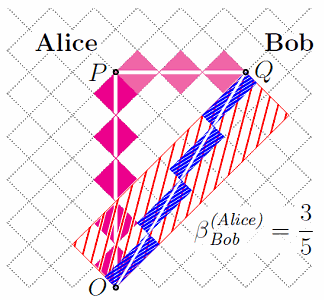
(Side comment: We have highlighted a parallelogram in the grid with diagonal OQ, which we refer to as the “causal diamond” of OQ. The area of that causal diamond is equal to the square of the time interval from O to Q. This suggests another, more powerful method to construct Bob’s clock diamonds if we know that OQ is along Bob’s worldline. Refer to the paper for details.)
We can easily extend this diagram to visualize the “clock effect”, featured in the so-called twin paradox. Inertial observer Alice stays at home and logs 10 ticks between separation and reunion events O and Z, whereas Bob (a piecewise-inertial—but now a non-inertial—observer since he momentarily accelerated at Q to turn around and return to Alice) logs 4+4=8 ticks from events O to Z via Q, not on inertial segment OZ.
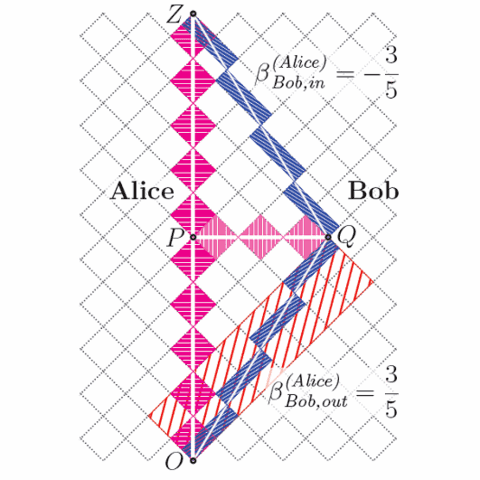
The Clock Effect visualized
Note that there are three inertial reference frames displayed here: Alice, outbound-Bob, and inbound-Bob. This is not easily constructed on the two-observer graph paper or on the hyperbolic graph paper, especially if Bob’s inbound speed is different from Bob’s outbound speed. (Note that the subdivided grid which displayed a glimpse of the unit hyperbola displayed clock diamonds for nine inertial reference frames.)
Final comments
Hopefully, this construction makes it easier to draw, interpret, and calculate with spacetime diagrams. So, let’s draw them! Refer to the paper for details of this method, other textbook examples (length contraction, velocity composition, elastic collisions), and its relation to other methods (radar methods, Bondi k-calculus, Robb’s formula, standard textbook formulas).
Update: 7/18/2016
There is a now follow-up Insight Relativity on Rotated Graph Paper .
Update: 8/24/2016
The last GeoGebra file features a tool to draw clock diamonds along segments so that one can more easily visualize the proper-time along timelike piecewise-inertial segments.
Further Reading
“Relativity on rotated graph paper,” Roberto B. Salgado,
Am. J. Phys. 84, 344-359 (2016); http://dx.doi.org/10.1119/1.4943251
[see also the references within]
“The Clock Paradox in Relativity Theory,” Alfred Schild,
Am. Math. Monthly, 66, 1-18 (Jan., 1959); http://www.jstor.org/stable/2309916
Relativity and Common Sense, Hermann Bondi (Dover, 1962).
“Space-time intervals as light rectangles,” N. D. Mermin,
Am. J. Phys. 66, 1077–1080 (1998); http://dx.doi.org/10.1119/1.19047
“Visualizing proper-time in Special Relativity”, Roberto B. Salgado,
Phys. Teach. (Indian Physical Society), 46, 132–143 (2004);
available at http://arxiv.org/abs/physics/0505134
Relativity on Rotated Graph Paper
Learn About Relativity on Rotated Graph Paper
Learn About Spacetime Diagrams of Light Clocks
Professor of Physics (BS,MS,PhD), Math (BS). Interested in relativity, physics, mathematics, computation, physics pedagogy.


@robphy your first Insight has proven very successful!
[QUOTE="David Lewis, post: 5517388, member: 575367"]Then I misread the graph. I thought the vertical axis (time) had tick marks one second apart.”Which graph are you talking about? None of the ones I saw in this thread specify a scale, so I was talking about the general case. If you've got a specific graph in mind which has a time axis scaled in seconds then yes, the x axis is scaled in light seconds as you said.
Then I misread the graph. I thought the vertical axis (time) had tick marks one second apart.
[QUOTE="David Lewis, post: 5517307, member: 575367"]So if I'm reading the graph correctly, each tick mark on the horizontal axis (position) represents a distance of about 299 800 000 metres?”3×10[SUP]8[/SUP]m times some constant A. The tick marks on the time axis represent A seconds. So you can use minutes and light minutes, years and light years, micro-fortnights and light micro-fortnights, etcetera etcetera.
[QUOTE="pervect, post: 5502497, member: 14402"]…the diagrams will most likely be drawn with c=1 to make the causal diamond appear square.”So if I'm reading the graph correctly, each tick mark on the horizontal axis (position) represents a distance of about 299 800 000 metres?
It's also known as the use of "light-cone variables". Maybe there's something in a textbook on this too, but I can't remember to have seen it anywhere. I still think the most simple way to understand the working of this kind of diagrams is to use the algebraic approach given in #7.
Here's a rather simpler proof than my last one., though it requires an understanding of the Lorentz transform, unfortunately.We start with the standard Lorentz transform$$x' = \gamma x – \gamma \beta c t \quad t' = \gamma t – \gamma \beta \frac{x}{c} \quad \gamma = \frac{1}{\sqrt{1-\beta^2}}$$What the transform does is take the coordinates for a stationary observer O, which are x and t, and transform them to the coordinates used by an observer O', moving at a velocity ##beta c## with respect to O.A diagram would really help here, but – it's too much work.We re-write the above via algebraic manipulation as:$$x' – c t' = k \left(x – c t \right) \quad x' + c t' = \frac{1}{k} \left(x + c t \right) \quad k = \sqrt{\frac{1-\beta}{1+\beta}}$$Optionally one might insist that c=1, or present the above form and then suggest that from this point on, c will be set to 1, as the diagrams will most likely be drawn with c=1 to make the causal diamond appear square. It would be more instructive (but more work) to use Bondi's k calculus (see for instance his book "Relativity and Common Sense" to derive the above result.Next we clarify the meaning of the left hand sides of the above. We can say that the formula ##\left| x – ct \right|## represents the length of one side of the causal diamond, and ##\left| x + ct \right|##, if we assume the "length of a side" is always positive. Hopefully it becomes clear that the area of the causal diamond (the product of the sides of the diamond) is left invariant under the Lorentz transformation, as re-written above), because the transform multiplies the length of one side by k and the length of the other side by 1/k. This leaves the product of the sides unchanged. As a bonus the equivalence (except for sign) ##\left| x^2 – c^2 t^2 \right|##, assumed to be positive, .and the Lorentz interval ##x^2 – c^2 t^2## (potentially of either sign) becomes reasonably clear.Sorry for the lack of diagrams.If you prefer a proof with similar triangles, there's one in Rob's paper, but personally I found the algebra easier to follow. But I wouldn't guarantee that's true for everyone.
[QUOTE="Swamp Thing, post: 5502458, member: 5126"]Thanks!
I'm wondering if the following heuristic argument makes sense… Imagine that we "sprinkle" space time with a lot of events that are more or less uniformly distributed. Now, for a given event, { being influenceable by O and being able to influence T } has to be an absolute, frame-independent property. So if a certain fraction of the sprinkled events have this property in one frame, then the same fraction has to have this property in any other frame, which leads to the notion that the area containing them can't change from frame to frame.”One has to be careful here.If you "uniformly distribute" a finite number of events in one frame, they won't be uniformly distributed in another frame.If you are looking for a proof that the area is preserved by a boost, recall that the determinant of the boost is equal to 1.If you want an explicit calculation, look at the earlier posts by [USER=14402]@pervect[/USER] and [USER=260864]@vanhees71[/USER] .
Thanks!I'm wondering if the following heuristic argument makes sense… Imagine that we "sprinkle" space time with a lot of events that are more or less uniformly distributed. Now, for a given event, { being influenceable by O and being able to influence T } has to be an absolute, frame-independent property. So if a certain fraction of the sprinkled events have this property in one frame, then the same fraction has to have this property in any other frame, which leads to the notion that the area containing them can't change from frame to frame.
[QUOTE="Swamp Thing, post: 5502443, member: 5126"]In the Geogebra page, the "causal diamond" has upper edges u1 & v1, and lower edges u0 and v0. I'd just like to confirm if I have understood the defining property of this diamond:-Is it the case that the causal diamond represents all events that are both influenceable from O and capable of influencing T?”Yes… more technically, it is the intersection of the future of O and the past of T.
In the Geogebra page, the "causal diamond" has upper edges u1 & v1, and lower edges u0 and v0.I'd just like to confirm if I have understood the defining property of this diamond:-Is it the case that the causal diamond represents all events that are both influenceable from O and capable of influencing T?
Agreed… But the issue of journal publishing is another topic altogether.The revisions pushed the more advanced topics into the later chapters and the appendix. For example, the geometrical proof inspired by Mermin's paper (which appeared early on in the paper) was moved into the appendix because some felt it was too much of a hurdle for the reader.The Bondi k-calculus based introduction and the the standard examples treated were effectively unchanged. I withdrew the proof of the Lorentz transformation formulas from the diagram because of space limitations. So, for beginning students, not much has changed.The revised introduction made better use of radar methods. This was later related to causal diamonds (which I think are more powerful than clock diamonds [which seem limited to velocities related to Pythagorean triples (I.e. rational k-factors)]). The revised version better clarified some technical issues.
I'd have to agree that there is plenty of benefit to be gained by the no-math approach in the insight article. It is a bit sad that the published article is paywalled – how extensive were the changes? Is it feasible to update the non-paywalled arxiv version, or would the publisher object? I'm not sure how much time/effort it would be worth, actually – just a thought.
Here is version 0.5 of a geogebra visualization:Light Clock Diamond (robphy) – v0.5https://www.geogebra.org/m/Jq4jDMRW [If you click on the objects in the table, you can see a description of the construction.]I'm working on a much fancier version for my upcoming talk at the MAA MathFest.
[QUOTE="vanhees71, post: 5501239, member: 260864"]The "area rule" becomes, as expected, clear when doing the (linear) algebra. A formula is worth 1000 diagrams ;-)).”This is true!… but only when one understands the meaning of the mathematical symbols and of the mathematical operations.That's why I felt it was worth developing this "multimedia", multiple-representations [algebraic, geometrical, physical] of the same idea.For a novice, it may be too much to ask for the algebra and analytic geometry in the beginning to learn relativity.For an expert, algebra and geometry and physics is needed to clearly show what input was needed to obtain the result.My goal to address both ends of the spectrum is one of the reasons that my revisions took so long.I had to find a balance I was happy with, given the numerous suggestions for improvement from colleagues and reviewers.”That's a very nice alternative to drawing the hyperbolae directly, because it's easier to construct without having a curve ruler at hand although nowadays it's no problem to draw hyperbolae with computer graphics programs. I like geogebra very much for that purpose.”Yes, thanks.However, the typical introductory student is–unfortunately–unfamiliar with hyperbolas.But they don't need to be. They need segments with tickmarks that are easy to read and interpret.In a problem in Euclidean geometry, unless we are doing a construction with a compass, we often don't need the underlying circles (or circular arcs) to work the problem.But, yes, tools like http://www.geogebra.org/ will make it easier to draw hyperbolas.I've been working on some geogebra visualizations to draw the diamonds [and hyperbolas] since my LaTeX pstricks-based graphics are tedious to construct and aren't dynamical.
The "area rule" becomes, as expected, clear when doing the (linear) algebra. A formula is worth 1000 diagrams ;-)).Let's start from the unit hyperbola in terms of a Minkowski frame,$$t^2-x^2=1.$$In parametric form it's given by$$\underline{x}(\eta)=\cosh \eta \underline{e}_0 + \sinh \eta \underline {e}_1,$$where underlined symbols stand for Minkowski vectors (in the plane of 1+1-dimensional spacetime).Now express the same in terms of "light-cone vectors" as basis vectors.$$\underline{l}_{\pm}=\frac{1}{2}(\underline{e}_0 \pm \underline{e}_1).$$Then you get for the hyperbola$$\underline{x}(\eta)=x^0 \underline{e}_0+ x^{1} \underline{e}_1=x_+ \underline{l}_+ + x_- \underline{l}_-=\cosh \eta (\underline{l}_+ + \underline{l}_-)+\sinh \eta (\underline{l}_+-\underline{l}_-) =\exp \eta \underline{l}_+ + \exp(-\eta) \underline{l}_-,$$which implies that in these light-cone coordinates ##x_{\pm}## the hyperbola fulfills the implicit equation$$x_+ x_-=1=\text{const}.$$Thus the area of the light diamonds of any inertial observer, defining the space-time units via a light clock (in fact that's how length and time are nowadays defined in the SI, i.e., by defining a time standard via a hyperfine transition in Cesium and then defining the speed of light in vacuo at a fixed value; theoretitians rather choose ##c=1## ;-)) is the same for any inertial observer. Knowing that leads to the construction of the Minkowski diagrams in terms of the paper and the Insights article. That's a very nice alternative to drawing the hyperbolae directly, because it's easier to construct without having a curve ruler at hand although nowadays it's no problem to draw hyperbolae with computer graphics programs. I like geogebra very much for that purpose.
http://arxiv.org/abs/1111.7254 points to the 2011 draft of "Relativity on Rotated Graph Paper".The published version in AJP ( http://dx.doi.org/10.1119/1.4943251 ) is longer and went through numerous refinements.Your interpretation of the "area of the causal diamond" is correct. It's essentially working in the eigenbasis of the Lorentz boost, with eigenalues equal to the Doppler factor and its reciprocal (since the determinant is one). It's not a new idea… it's in the literature… but not well known.The new idea is that calculations can be done on rotated graph paper, with emphasis on counting and invariance [rather than formulas] and physical (operational) interpretation. The completed diagram contains all of these features, which lends itself to hopefully easier interpretation.
I see what I think is the same paper on arxiv, but I'm not sure I should be the one to post a link. I had this urge to work it out for myself in my own terms, it seemed like there should be some really simple explanation for this relationship. For a suitably complicated definition of "simple".What I finally came up with is that if we define the two null vectors u and v, we can represent what you call "the area of the causal diamond" as the wedge product u ^ v in the rest frame of the light clock. I suppose I need to specify u and v, I'll just say that the line element of the metric is 2 du dv, and that specifying the line element defines the coordinates and the basis vectors ##\partial_u## and ##\partial_v##. Modulo some possible multiplicative factors then, the "area of the causal diamond" is u ^ v. Now we do a Lorentz boost, and we get new basis vectors in the boosted frame, u' and v', via u' = ku and v' = (1/k) v, where k is the bondi k-factors for the boost, i.e. the doppler shift. We can look at the "area of the causal diamond" in the boosted frame, and note that it is also given by u' ^ v' = (ku) ^ (1/k) v = u v.I should probably read the paper over and see if you already said this and I just re-invented the wheel.
[QUOTE="pervect, post: 5500988, member: 14402"]A very interesting and thought provoking article. Seeing the diagrams, I am wondering if there is any physical interpretation of the area of the squares, possibly related to the Lorentz interval.”Thanks.In 1+1 Minkowski spacetime, the area of a causal diamond in units of the area of a clock diamondis equal to the square interval of the timelike diagonal, and negative of the square interval of the spacelike diagonal.(I don't call them squares or rectangles because the sides are lightlike, and thus are not spacetime-perpendicular to each other. The diagonals are spacetime-perpendicular to each other.)The signature comes out when using an extension of the Robb formula for the product of radar-time-intervals.Details are in the paper. (Before I wrote up the Insight, the paper was freely downloadable.. But now it seems it's not free.)
A very interesting and thought provoking article. Seeing the diagrams, I am wondering if there is any physical interpretation of the area of the squares, possibly related to the Lorentz interval.
I don't want to be over critical here, and I'm sure the penny will drop at some point and I'll feel very stupid, but I don't really understand this at all on first reading . . . !!!(I appreciate this is probably not aimed at someone who already understands spacetime diagrams.)
The Insight assumes some familiarity with spacetime diagrams (position-vs-time diagrams, with the convention that time runs upward on the diagram). The paper it is based on develops the spacetime diagram for the beginner and has some advanced concepts for those already familiar with spacetime diagrams and special relativity.
That is neat. I'll have to read in more detail when I'm not on my way home from someone's leaving drinks, but I really like the easy way to generate a hyperbola.
Very clever. Congratulations. I like it. I hope that it could be used to answer FAQ.
But I was thwarted in being able to read your paper because it is behind a paywall. Is there a link to a non-paywalled copy?
Thanks.
There was another comment thread where that question came up.
Here’s my reply:
https://www.physicsforums.com/threads/spacetime-diagrams-of-light-clocks-comments.875884/#post-5501116