Gaia Astrometry: Detecting Gravitational Waves Guide
Table of Contents
Overview
Gravitational waves (GWs) are disturbances in spacetime produced by massive objects moving asymmetrically. Only the most massive and most relativistic systems produce GWs large enough to be detectable. The Laser Interferometer Gravitational-Wave Observatory (LIGO) and Virgo detectors use laser interferometry to detect tiny ripples in the fabric of spacetime; they have already detected dozens of GWs from binaries of black holes and neutron stars. An additional detection method is a pulsar timing array (PTA), which monitors dozens of millisecond pulsars to look for the signatures of nanohertz GWs — waves with much lower frequencies than those seen by LIGO and Virgo.
Astrometry and Gaia
Astrometry — precise measurement of the apparent positions of stars — provides another route to detecting GWs. This idea was first introduced in 1990 and has become more relevant with the Gaia mission, which delivers astrometric observations at unprecedented precision.
Key points about gravitational-wave detection
- Gravitational waves (GWs) are spacetime disturbances produced by massive objects moving asymmetrically.
- LIGO and Virgo use laser interferometry to detect GWs from compact-object binaries.
- Pulsar timing arrays (PTAs) use dozens of millisecond pulsars to search for nanohertz-frequency GWs.
- Astrometry detects changes in the apparent positions of stars and can be used to identify GWs.
- GWs modulate spacetime and cause the apparent sky positions of objects to change with time.
- Researchers developed a compression method that reduces the Gaia dataset size by a factor of 1 million with only ~1% loss of sensitivity.
- The sensitivity of the compressed Gaia dataset is comparable to that of pulsar timing arrays and may complement PTAs at higher GW frequencies.
- The most sensitive sky regions for Gaia are near the galactic poles; the least sensitive are toward and away from the galactic centre.
- Gaia may help detect GWs from supermassive black-hole binaries in distant galaxies, aiding studies of these systems.
Related media
YouTube: Gaia and gravitational waves (video)
How astrometry (Gaia) can detect gravitational waves
Imagine, long ago in a distant galaxy, two supermassive black holes orbiting one another and emitting GWs. Those waves are reaching us now and passing through the Milky Way. As they travel through the Galaxy they modulate spacetime and therefore change how photons propagate between objects.
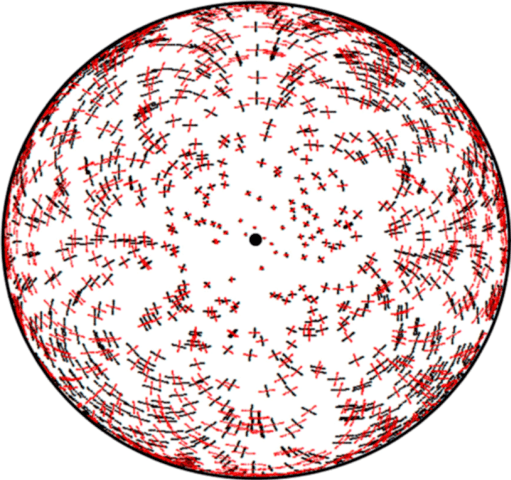
One consequence — exploited by PTAs — is a change in the travel time of photons between pulsars and Earth. Another consequence, relevant for astrometry, is a time-dependent deflection of light similar to gravitational lensing: a GW alters the apparent sky positions of objects, producing tiny, coherent motions across the sky (see Figure 1).
Gaia’s dataset: huge reach, computational challenge
Gaia measures the positions of more than a billion stars with astonishing precision. The large sample increases sensitivity, but the full dataset is computationally challenging to analyze. To overcome this, researchers compress the sky by partitioning it into Voronoi cells and averaging the astrometric data of stars within each cell. Each cell becomes one “virtual star,” reducing the dataset size by roughly a factor of 1,000,000 while decreasing sensitivity by only about 1%.
Simulations and Gaia sensitivity
To assess Gaia’s GW sensitivity, researchers created simulated datasets containing GW signals with varying amplitudes and frequencies and determined, at each frequency, the minimum amplitude detectable. They found the compressed Gaia dataset has sensitivity comparable to PTAs and may complement them at higher frequencies.
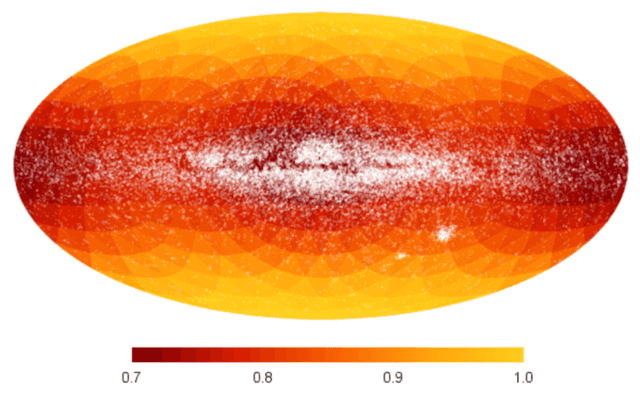
Sky-location matters: the most sensitive Gaia regions are near the galactic poles, while the least sensitive regions are toward and away from the galactic centre. The difference between the best and worst sky locations is roughly 30%. This pattern follows from Gaia’s sky coverage and the GW astrometric response, which is strongest perpendicular to the GW propagation direction. By contrast, PTAs are most sensitive toward the galactic centre; therefore Gaia may complement PTAs both in frequency and in sky coverage.
Implications for multi-messenger astronomy
Gaia was designed to map the Milky Way, but its astrometric sensitivity to GWs means it could also help identify supermassive black-hole binaries in distant galaxies. Because Gaia’s best sensitivity lies away from the galactic plane, detections by Gaia could be particularly valuable for multi-messenger follow-up: a GW source far from the plane has a higher chance of yielding an observable electromagnetic counterpart.
References & discussion
References: Gilmore, G.; Lasenby, A.; Mihaylov, D. P.; Moore, C. J. (Department of Applied Mathematics and Theoretical Physics, Centre for Mathematical Sciences, University of Cambridge, UK).
A Nuclear Fusion Physicist and Astrophysicist.
BSc Physics & Engineering, MSc Nuclear Physics & Engineering, MSc Astrophysics, PhD Plasma Physics


Always nice to see how experiments get more tasks than they were designed for.
Do you have numbers how much we expect each star position to change? Is this something in the range of the parallax resolution of stars, or is this more like “everything shifts by 0.001 standard deviations and we need millions of stars to be sensitive” (i.e. nano-arcseconds)?
I know it’s difficult for Gaia to get relative positions of stars across large separation in the sky, and that’s probably what they need here: They just have two relatively narrow fields of view 60 degrees apart, so their correlation matrix is very thin.