
Learn Simple Python Debugging with Pdb
I’m pretty new to Python, so I was looking around for some debugging tools. At first, I dismissed Pdb (Python debugger) as being too primitive, but after seeing a blog post about using Pdb, I decided that I should give it a try.
Table of Contents
To get started with Pdb
- import the pdb module
- insert a call to the set_trace() method
Here is a simple Python example that calculates and displays a few points on a line. The program is not very interesting and serves only as a vehicle to talk about debugging.
import pdb
def fun(x):
return 3 * x + 1
pdb.set_trace()
for x in range(2, 9):
y = fun(x)
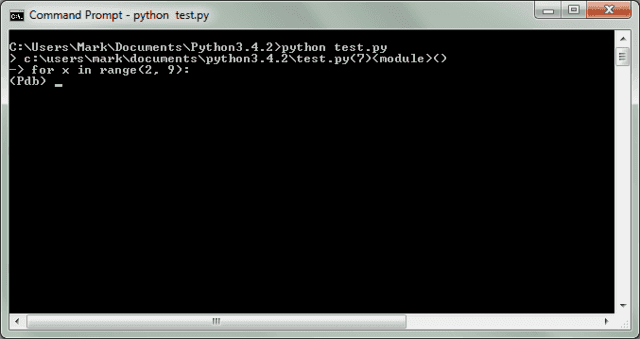
print(“(x,y) = (“, x, ” ,”, y, “)”)When I run the code above (test.py), execution stops at the break-point I set just before the start of the for loop. The line that is shown — -> for x in range(2, 9): — is the next line to be executed.
Following that line is the Pdb prompt, (Pdb)
We’re now ready to enter some commands. Some of the commands that I’ve found most useful are these:
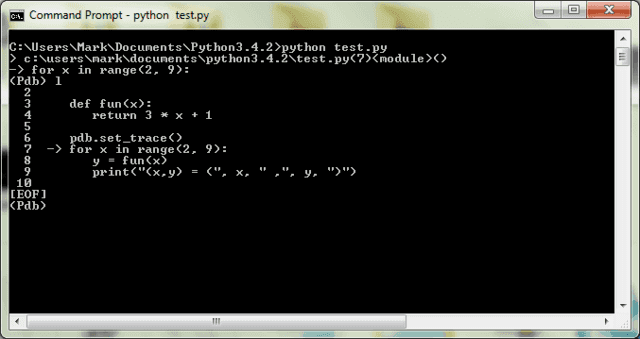
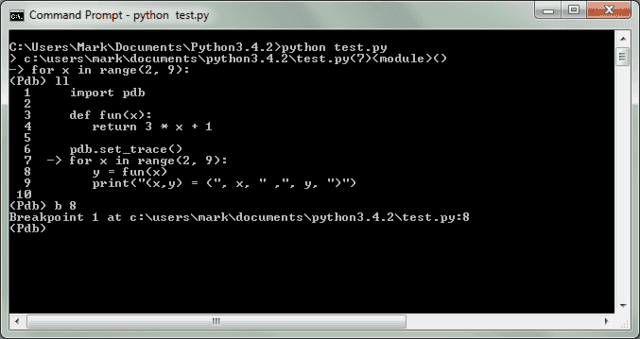
l (lowercase L) or list – list eleven lines of code around the current position
ll (lowercase L’s) or longlist – list all source code for the current function or frame
Most of the Pdb commands have short forms. To see all of the Pdb commands, type h or help at the Pdb prompt. For help on an individual command, type h or help, followed by the command.
Here is the result of typing l (ell) at the Pdb prompt:
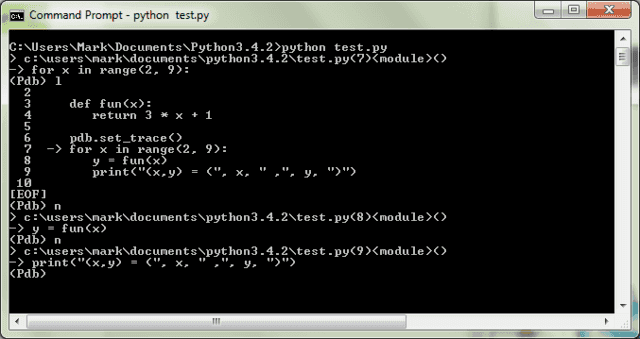
Pressing n or typing next takes us to the next line of code. Pressing n again takes us to the print() statement at the end of the loop body.
Another command, s or step, is similar to n (or next) but will step into a function call rather than stepping over it as s does.
In the next screenshot, the current line is the print statement at the end of the loop body.
An important feature of any debugger is the ability to display the value of a variable. This we can do with the p (or print) command. In the screenshot above, the current line is the print statement, which means it is the next statement to execute. The previous statement, “y = fun(x)” has been executed, so we can see the value of y and x as shown below.
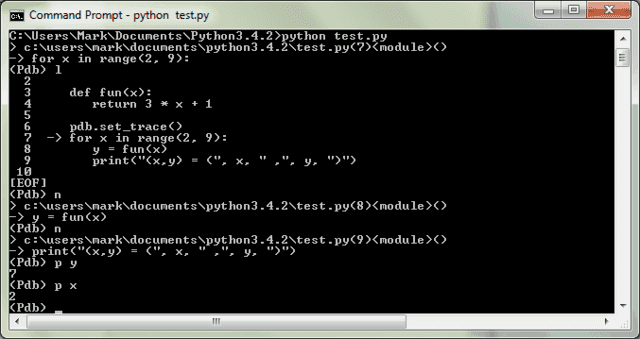
In the screenshot above, we can see that p y results in a value of 7, and p x results in a value of 2.
In summary:
To use Pdb to debug a Python script:
- Import the pdb module, with a line near the top of your script.
import pdb - Call the Pdb method, set_trace().
pdb.set_trace()
Place the call to this method where you want execution to stop. - Get your bearings with l (or list) or ll (or longlist).
- Move through your code with n (or next) or s (or step).
- Display a value using p <var>, where <var> is the name of the variable or expression you want to display.
- For a list of all Pdb commands, type h or help. For help with a specific Pdb command, type h followed by the command, e.g., h break or more simply h b.
Part 2: Breakpoints
In summary:
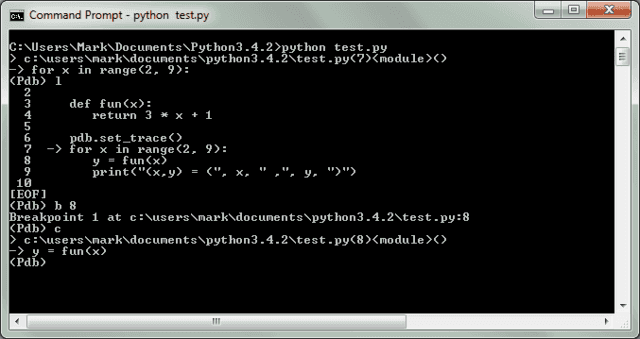
- Set a breakpoint by typing b or break, followed by the line number at which to set the breakpoint.
- Clear a breakpoint by typing cl or clear, and the number (not the line number) of the breakpoint.
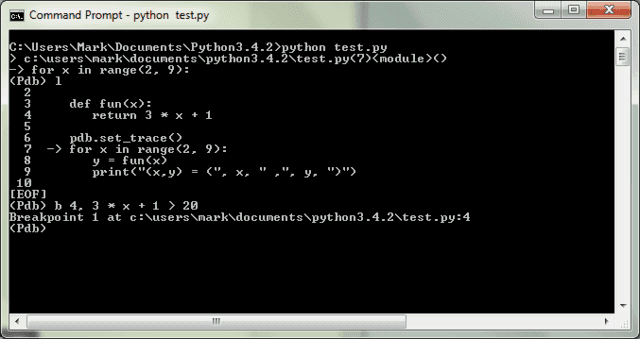
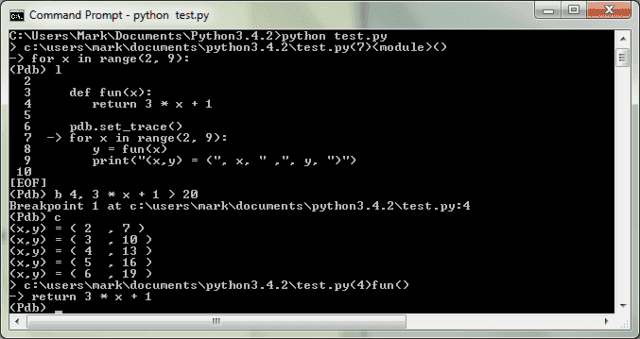
- Set a conditional breakpoint by typing b (or break), followed by the line number, followed by a comma, and then the logical condition.
- As already mentioned, typing h (or help) at the Pdb prompt lists all of the commands, and typing h followed by a specific command gets you to help for that command.
Former college mathematics professor for 19 years where I also taught a variety of programming languages, including Fortran, Modula-2, C, and C++. Former technical writer for 15 years at a large software firm headquartered in Redmond, WA. Current associate faculty at a nearby community college, teaching classes in C++ and computer architecture/assembly language.
I enjoy traipsing around off-trail in Olympic National Park and the North Cascades and elsewhere, as well as riding and tinkering with my four motorcycles.


Here is part 2
[URL]https://www.physicsforums.com/insights/simple-python-debugging-pdb-part-2/[/URL]
Ok images should be fixed now
Thanks for reporting the image problem. I am fixing it now. Check back in 10 minutes.
Thanks Greg – Works like a charm!
Can not see the images, only 'x'.
Hi Mark,Python has been the language of choice on my physics course, so i'm interested in posts such as these.However, I cannot view the pictures you have uploaded, except for the first one. I'm bringing this to your attention in case anyone else has this problem. (Chrome on OSX if that is useful).Thanks!