
LHC Part 4: Searching for New Particles and Decays
View All Parts
Part 1: LHC about to restart – some FAQs
Part 2: Commissioning
Part 3: Protons as Large as a Barn
Part 4: Searching for New Particles and Decays
The LHC experiments are in full swing collecting data this year (more information in the forum), and a while ago the collaboration of the CMS experiment released 300 TB of old (2011) data that everyone can analyze (forum thread). But how do these analyses look like? There are two main analysis types:
- Searches for new particles, or new decays of known particles
- Precision measurements of existing particles and their decays
In general, searches are easier to do and to understand, this article will focus on these.
Nearly all models of new particles predict them to be short-living – they decay before they reach the detectors, all we can see are their decay products (sometimes not even those, more later). This is also true for the known particles studied at the LHC – particles long-living enough to cross the detector cannot be studied properly and get analyzed at different experiments with higher precision. This leads to an unintuitive result: We only detect particles we are not interested in. Everything else has to be reconstructed from the decay products. This also means searching for completely new particles, and searching for an unobserved decay of a known particle have much in common. One difference: For new decays the mass is known, while the mass of undiscovered particles is unknown.
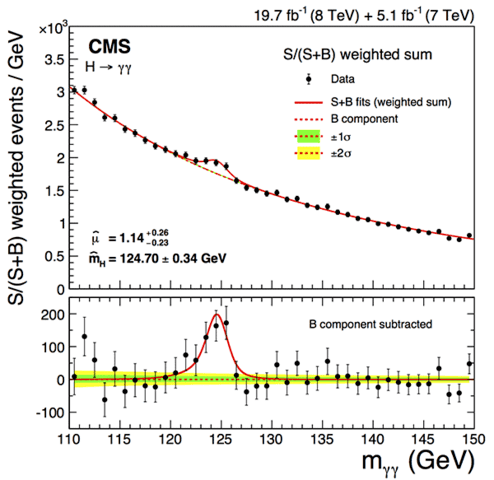 Consider the Higgs boson, for example. It can decay to two photons, their energies and flight directions are then measured by the detectors. Assuming that they came from the decay of a single particle, it is possible to calculate the mass of this particle (the invariant mass of the system). Within the detector resolution of about 1%, an actual Higgs decay will always give the Higgs mass of about 125 GeV. Collisions can also produce two photons without any Higgs involved (“background”). These have a broad spectrum in the invariant mass, so the Higgs analyses are looking for a narrow peak over a broad background. The graph on the right (upper part) shows the result of the CMS collaboration with data from 2011 and 2012. As you can see, the peak is clearly there at a mass of 125 GeV, but it is small compared to the background. In more technical terms, the signal to background ratio is much smaller than 1. Even if a photon pair looks exactly like a Higgs boson decay, it is probably from background. There is no event where you could point to and say “see, this is a Higgs decay to photons!” It might be from a Higgs, but it is probably not. Only a statistical analysis allows to confirm the existence of a particle there. After subtracting the expected number of background events, you get the lower plot, where the peak is much easier to see.
The Higgs boson has a probability of about 0.2% to decay to two photons, while its probability to decay to a bottom/antibottom quark pair (##b \bar{b}##) is about 58%, a factor of 250 more. Why do we even look for photons? The signal for ##b \bar{b}## is larger, but the background is larger as well. Quark/antiquark pairs can be produced by the strong interaction. In addition, these quarks form sets of hadrons, called jets. Measuring the energy of jets is challenging, and the uncertainties are much larger than the uncertainties of photon energy measurements. This makes the mass peak broader and therefore harder to detect, the signal to background ratio is much smaller than for the decay to photons. There could be other particles decaying to ##b \bar{b}##, however, so this spectrum is still studied.
Table of Contents
Supersymmetry – where did my energy go?
Many of the current searches are looking for supersymmetry: the prediction that every particle has a partner that we did not find yet. Supersymmetry could solve some theoretical problems with the current model, and it would also give a plausible candidate for dark matter particles, connecting particle physics to astrophysics and cosmology. It is predicted that the lightest supersymmetric particle (LSP) is stable, or has a very long lifetime (at least tens of billions of years). If supersymmetry exists, and if the LHC can produce supersymmetric particles, most of them should quickly decay to lighter particles, ultimately producing the LSP plus some other particles. We know dark matter does not interact notably with normal matter – the LSP would escape the detector, in the same way neutrinos do. It would still leave some detectable signature: overall momentum is conserved. LHC experiments cannot accurately measure particles that travel very close to the beams (the detectors need holes for the beams…), but ATLAS and CMS can measure all particles that go in all other directions: two of the three momentum components can be measured completely. If all particles are detected, the total sum of them is zero. Deviations are called “missing transverse energy”. As an example, if some high-energetic particle goes upwards, but nothing visible goes downwards, the measured sum is not zero, and some invisible particle escaped in downwards direction. This is a powerful tool: if a collision has a large missing transverse energy, then either a neutrino or a new particle got produced. And we know the processes that produce neutrinos quite well so we can estimate how frequent they are, and compare that to the observed frequency. If we see more than expected, it could be a new particle – or a systematic error, or just a statistical fluctuation. Systematic uncertainties are a large topic (and many analyses spend most of their time on those), but typically not the limiting factor in searches.
Statistics
No analysis works without a statistical analysis of the results. The following examples introduce some of the main aspects for searches:
- Studies show that we expect to find 5 events in the analysis, we see 10. More than expected – but is it a new particle or just a random fluctuation? The number of events follows a Poisson distribution, if there is no new particle the mean is ##\mu=5## and the standard deviation is ##\sqrt {5}##. The probability of seeing 10 or more events without a new particle is 3.2%. Unlikely, but possible, and a new particle is even less likely. Instead of using these probabilities, particle physicists typically convert them to the significance given in “sigmas”: for a Gaussian distribution, how many standard deviations away do we get the same probability? In this case, it is about 1.8 sigma. Typically 3 sigma (0.14%) are necessary to get anyone interested, and 5 sigma (3*10-7) are needed to call something “observation”.
- A different analysis has 50 different categories and looks for particles in all of these. In all categories, 5 background events are expected. Category 24 has 14 events. The probability of this without a new particle is just 0.07%, much lower than the 3.2% from above. A new particle? Well, we considered 50 different categories here. The probability that at least one of them shows 14 or more events is about 50*0.07% = 3.5%. By looking at more places, we made it more likely to see larger statistical fluctuations. This is called look-elsewhere-effect or trials factor. To account for that, experiments often give two significance values: a local one (derived from the 0.07%) and a global one (derived from the 3.5%).
- Another analysis does not have categories, but looks for peaks in the invariant mass spectrum. The local significance typically comes from a fit to data, but finding a global significance is more challenging: there are no separate categories, but a continuous interval, and the detector resolution is not perfect. If you have more events in the range “100 ##\pm## 10” (random example), you also have more events in the ranges “101 ##\pm## 10” and “102 ##\pm## 10”, but not necessarily in the range “130 ##\pm## 10”. You cannot make separate categories out of the spectrum. The typical approach here is to simulate the background spectrum many times, and then see how frequent there is a fluctuation anywhere.
- Estimating the background can be challenging as well. For a smooth background with many events (see the Higgs from above for an example), experiments typically find some functions that fit well, without a deeper theoretical motivation. If not many background events are available, or the background is not smooth, simulations are used, often adjusted in complex ways to be as reliable as possible. This can lead to notable systematic uncertainties.
2 ##\gamma## or not 2 ##\gamma##, that is the question.
In December 2015, ATLAS and CMS, the two biggest experiments at the LHC, presented the results of about 20 searches each based on data collected in 2015 – at a much higher energy than the collisions before. Most of them were without surprises, but the search for particles that decay to two photons had interesting results. Both experiments saw more events than expected in one mass range – nearly the same range in both experiments. The local significances were given as 3.9 sigma (ATLAS) and 2.6 sigma (CMS). The global significances were just 2.0 (ATLAS) and less than 1.2 (CMS) – but the excess was observed at the same place, so we cannot “look elsewhere” for both experiments separately. Both experiments updated their analyses later (ATLAS, CMS), the local significance for CMS went up to 3.4 sigma. See also this forum discussion.
While not significant enough to claim a discovery of a new particle, this excess lead to huge excitement in the theorist community – more than 500 papers have been written, trying to explain it in terms of new physics. If it is a new particle, it would revolutionize particle physics: the first unexpected particle discovery since the Standard Model has been developed (1967). In addition, most models predict the existence of additional particles that could be searched for. Due to the excellent performance of the LHC, the collected datasets from 2016 are much larger than those from last year already. First results are expected for the upcoming ICHEP conference, presentations of the analyses are scheduled for Friday August 5th. A really weird statistical fluctuation, a new particle, or some weird experimental effect?
We will know more soon.
Working on a PhD for one of the LHC experiments. Particle physics is great, but I am interested in other parts of physics as well.


Someone made a video about the same topic, and with nice animations.
The recent W mass measurement was done with 7 TeV data, and there are various studies with 7 and 8 TeV ongoing. Precision measurements take time.The most recent datasets are not made public yet because the collaborations that built the detectors and did all the work to gather the data also want to analyze it first. This is not particle-physics specific. A group doing some laser physics or whatever also doesn't release raw data before writing a publication about the results. Chances are good you'll never see the raw data for most experiments. In particle physics, you do.
[QUOTE="Tommy 101, post: 5683608, member: 611871"]but that is only 8 Tev.”I am not sure, but I guess that's the point. Data that have been thoroughly studied should be accessible to groups or people outside the collaboration. Data is always useful [educationally or even for researchers and some theorists].Also don't underestimate the 8TeV, studies are still being done on those samples… afterall, ATLAS is not just a machine dedicated to search for new physics, but it studies the Standard Model too (cross sections, polarizations etc).[QUOTE="Tommy 101, post: 5683608, member: 611871"]We all know the fun stuff happens past 10 Tev”Do we? it may even start past 20TeV.[QUOTE="Tommy 101, post: 5683608, member: 611871"]Meanwhile we anxiously await for ALICE. An event happens they just dont have capabilities to interpret dataset.”I don't understand your latest sentence here, could you make it clearer?
Its good they released ATLAS datasets but that is only 8 Tev. We all know the fun stuff happens past 10 Tev. Meanwhile we anxiously await for ALICE. An event happens they just dont have capabilities to interpret dataset.
Very nice and understandable article, [USER=405866]@mfb[/USER]! I did not read it until today, but better late than never.
Unfortunately it looks like the TAG data (event metadata) that I'm interested in analyzing is only stored in a relational database, which is not available for download.
Both ATLAS and CMS released older datasets, LHCb has some tiny example datasets but will publish more soon, ALICE will follow as well.ATLASCMSThe full released CMS dataset has 300 TB. Dealing with that on a local machine can be "tricky," but they also have smaller subsamples. I don't know the size of the ATLAS data, but I would expect it to be similar.Both datasets come with additional simulation samples necessary to understand the detector better.
I think some datasets became available to public last year? I think if you search for it, you may find a way to access them without having to be a member of the collaboration, and they should be easy to deal with on a local machine.
Sounds like a similar data pipeline to what I use for mining network and host events for interesting security events, though on a much larger scale (I'm currently condensing 20-30 million filtered and stored events per day into ~30 "interesting" events). Thanks for the link [USER=494486]@ChrisVer[/USER], I'm definitely going to read through it and maybe even get me some LHC data to play around with. Thanks guys!
The experiments start with a 40 MHz bunch crossing rate. At ~2 MB/event (ATLAS/CMS, lower for LHCb) that is 80 TB/s. You cannot even read out such a data rate. The experiments read out a small part and look for the most interesting collisions there (mainly looking for high-energetic processes). That reduces the event rate to ~100 kHz (ATLAS/CMS) or 1 MHz (LHCb). 200 GB/s are then fed into computer farms and analyzed in more detail. Again the data is reduced to the most interesting events, ~1 kHz for ATLAS/CMS and ~10 kHz for LHCb. Those are stored permanently. The information which possible physics process happened there (e. g. "the reconstruction found two high-energetic electrons") is also stored.Individual analyses can then access those datasets. As an example, an analysis could look for events with two high-energetic electrons: Those might have a rate of 3 Hz during data-taking, which means you have something like 12 million events (~20 TB for ATLAS/CMS). That number varies a lot between analyses, some have just a few thousand, some have 100 millions. Those events are then processed by the computing grid, typically producing a smaller dataset (gigabytes) with just the information you care about. The GB-sized files are typically .root files and studied with C++ or python on single computers or a few computers at a time. Everything before that is code and data formats developed for the individual experiments.ALICE has much lower event rates, so the earlier steps are easier there, the later steps look very similar.
[QUOTE="stoomart, post: 5647236, member: 609490"]What kind of data files and analytics software are you guys using to dig through 2.5+ quadrillion collision events?”That's why triggers are used; to decrease the rate of collecting events to a handleable size [not on a local computer of course]. For local computers the sizes you're dealing with depend on the number of the recorded data and the analysis you are doing.
What kind of data files and analytics software are you guys using to dig through 2.5+ quadrillion collision events?
Great overview.as a quantum gravity guy trying to learn more about phenomenology your articles are just perfect!
[USER=124113]@Ygggdrasil[/USER]: CMS published their result already: absolutely nothing. I made a new thread.
Found this nice description by CERN, slightly different focus but a large overlap in the topics. With more pictures!
Thanks :)[QUOTE="Ygggdrasil, post: 5534038, member: 124113"]Any guesses at this point, or should we all wait for Friday to see what the additional analyses have turned up?”Wait for Friday. I won't comment on rumors.
Excellent article with very clear explanations. [quote]By looking at more places, we made it more likely to see larger statistical fluctuations. This is called look-elsewhere-effect or trials factor.[/quote]This is also known as the Green Jelly Bean effect in the medical sciences or p-hacking in the social sciences.