Learn About Spacetime Diagrams of Light Clocks
We demonstrate a method for constructing spacetime diagrams for special relativity on graph paper that has been rotated by 45 degrees. Many quantitative results can be read off a spacetime diagram simply by counting boxes, with very little algebra—I like to describe this as a method for doing “visual calculations” in relativity. The details are presented in my recent paper (“Relativity on Rotated Graph Paper”, Am. J. Phys. 84, 344 (2016); http://dx.doi.org/10.1119/1.4943251 ). This Insight provides an overview of the idea.
Table of Contents
The Spacetime Diagram
The spacetime diagram (“a position vs time graph”) is a valuable tool for modeling and interpreting situations in relativity. As I like to say, “A spacetime diagram is worth a thousand words.” Many problems and “apparent paradoxes” (or better “puzzles”) can be resolved by drawing a good spacetime diagram. However, because Minkowski spacetime geometry is not Euclidean, there is a hurdle to interpreting the spacetime diagram. As Alfred Schild eloquently stated,
“When it comes to metrical concepts, our Euclidean intuition is no longer valid in space-time—it cannot be trusted. Here we have to re-educate our intuition and learn to think in terms of new pictures. Thus, equal lengths in Minkowski geometry will not look equal, right angles will not look like right angles.”
(Side comment: Before we get into special relativity, it is worth noting that PHY 101’s “position vs time graph” also has an underlying geometry that is not Euclidean. However, practically everybody has learned to read the position-vs-time graph—without knowing anything about this geometry. To help students better understand special relativity, we may have to become more aware of this geometry… but that’s a story for another day.)
Where are the tickmarks?
Although we may be given the tickmarks of the inertial observer drawing the spacetime diagram, a common question is “how does one know where to mark off the ticks of another observer’s clock and meterstick?” More precisely, “given a standard of time marked on an observer’s worldline, how does one calibrate the same standard on the other observer’s worldline?”
Traditionally, this is answered algebraically using the Lorentz Transformation formulas… which is rather abstract for a novice. Geometrically, one may use two-observer diagrams or hyperbolic graph paper—which are rather restrictive. [We use the usual conventions where the time axis is vertical and where the units are chosen so that light signals are drawn at 45 degrees.] The two-observer diagram can only accommodate two frames of reference, and the diagram must be prepared for the velocity of the “moving” frame (here, ##v_{Bob}=3/5##). The hyperbolic graph paper can handle more general velocities but distinguishes the meeting event at the “origin”. For simple problems, either of these is probably sufficient. But what features are they emphasizing? Are these unnecessarily complicated? Unnecessarily expensive?
We propose a new type of graph paper—actually, a new use of plain old graph paper:
Rotated Graph Paper.
The grid lines are aligned with the light cones in spacetime. So, light signals are easier to draw.
But how do we get the 4 ticks along Bob’s worldline that we get from the other graph papers? The paper uses a physical argument based on the Doppler Effect and Bondi’s k-calculus. Here, we will use a geometrical argument (also found in the paper).
Diagramming Alice’s ticking Light Clock with “Clock Diamonds”
We begin the construction by interpreting the unit boxes in the rotated grid. Consider an inertial observer, Alice, at rest in her reference frame, carrying a mirror a constant distance away. Alice emits a light flash (traveling with speed c) that reflects off the distant mirror and returns (at speed c) to her after a round-trip elapsed time. If this returning light flash is immediately reflected back, this functions like a clock, called the light clock.
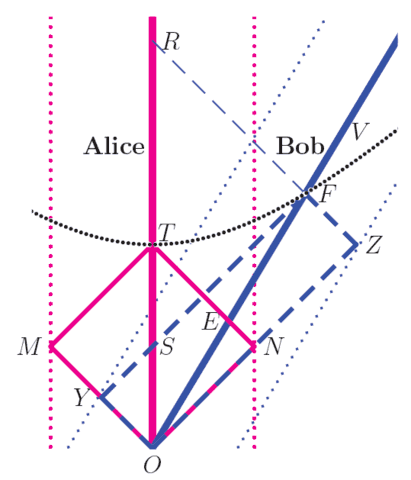
On the rotated grid, we draw the spacetime diagram of Alice and two such mirrors, one to the right (the direction in which Alice faces) and the other to the left. The parallelogram OMTN represents one tick of Alice’s longitudinal light clock, where the spatial trajectories of the light signals are parallel to the direction of relative motion. Henceforth, we will refer to this parallelogram as Alice’s “clock diamond.”
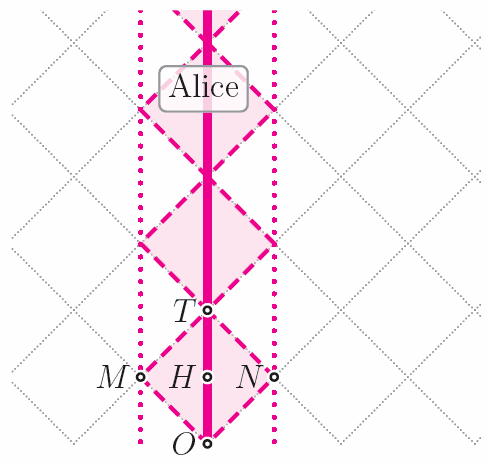
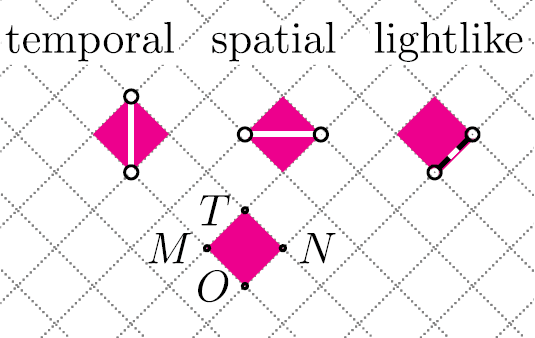
By tiling spacetime with copies of her clock diamond, Alice sets up a coordinate system. She measures displacements in time along a parallel to her worldline (along with diagonal OT, which happens to be vertical on our rotated grid). She measures displacements in space along her “line of constant time” (parallel to diagonal MN, which happens to be horizontal on our rotated grid). According to Alice, events, M and N are simultaneous. Lightlike displacements are measured parallel to the edges of her clock diamond.
Building Bob’s Clock Diamonds
Now consider another inertial observer Bob. For convenience, suppose ##v_{Bob}=3/5##.
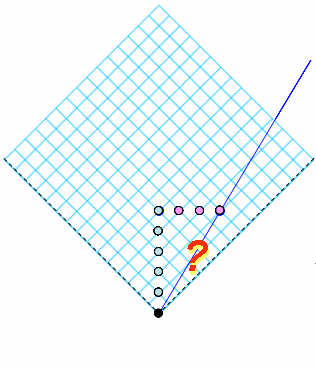
How should Bob’s light clock and clock diamonds be drawn?
This is the Calibration Problem.
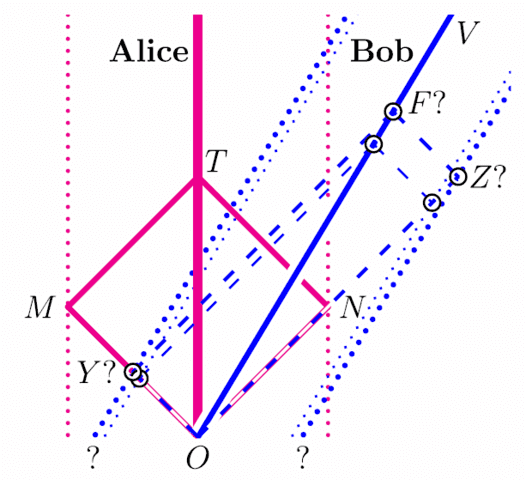
Given Alice’s worldline and one tick of Alice’s clock (clock diamond OMTN), how should one draw event F on Bob’s worldline so that timelike segment OF corresponds to one tick on Bob’s clock (clock diamond OYFZ)?
It turns out that
Bob’s clock diamond OYFZ
has the same area as
Alice’s clock diamond OMTN.
Geometrically, this is because events T and F lie on a hyperbola centered at O with asymptotes along the light cone of O. (Refer to the paper for physical arguments based on the Doppler Effect and Bondi’s k-calculus.)
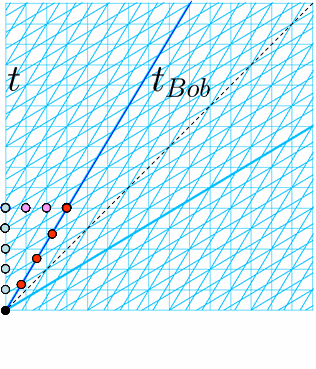
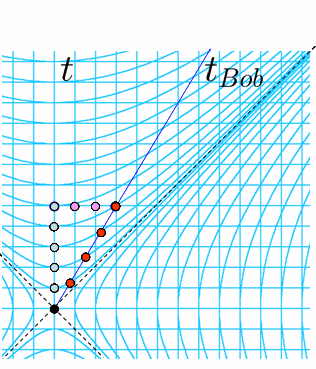
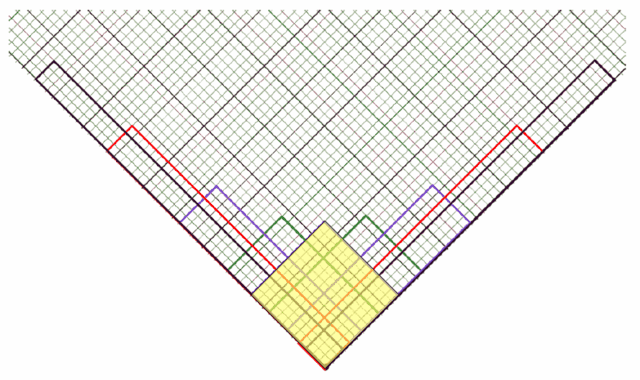
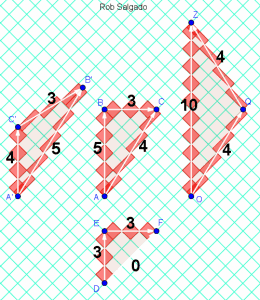
By subdividing the grid (into, say, a 6 x 6 subgrid) and drawing analogous clock diamonds with the same area, you can glimpse the unit hyperbola.
The velocity of a clock in this spacetime diagram is encoded by the width-to-height “aspect ratio” of its clock diamond. So, for Bob, we have:
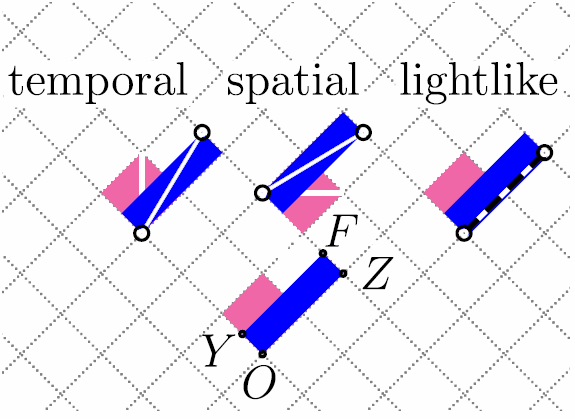
Note that events Y and Z of Bob’s clock diamond OYFZ are simultaneous for Bob—but not for Alice. This is the “relativity of simultaneity.” In the geometry of the spacetime diagram, diagonal YZ is [spacetime-]perpendicular to diagonal OF, even though it may not look so to a Euclidean eye.
Visualizing Time Dilation and the Clock Effect (Twin Paradox)
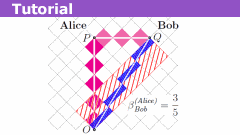
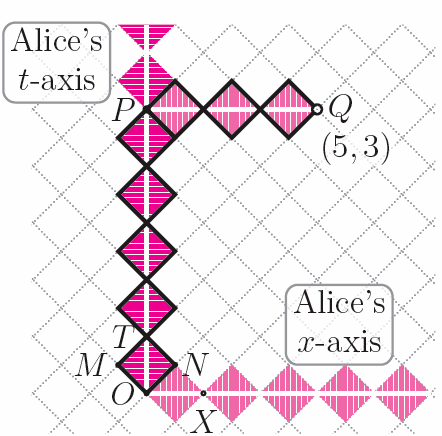
With Bob’s clock diamonds determined, we can now construct the 4 ticks along Bob’s worldline that one obtains in the two-observer graph paper and hyperbolic graph paper. This triangle visualizes “time dilation”: Bob determines the elapsed time from O to Q (events on his worldline) to be 4 ticks, whereas Alice determines the elapsed time from O to distant event Q (Q, not on her worldline) to be 5 ticks.
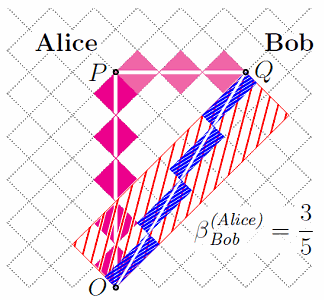
(Side comment: We have highlighted a parallelogram in the grid with diagonal OQ, which we refer to as the “causal diamond” of OQ. The area of that causal diamond is equal to the square of the time interval from O to Q. This suggests another, more powerful method to construct Bob’s clock diamonds if we know that OQ is along Bob’s worldline. Refer to the paper for details.)
We can easily extend this diagram to visualize the “clock effect”, featured in the so-called twin paradox. Inertial observer Alice stays at home and logs 10 ticks between separation and reunion events O and Z, whereas Bob (a piecewise-inertial—but now a non-inertial—observer since he momentarily accelerated at Q to turn around and return to Alice) logs 4+4=8 ticks from events O to Z via Q, not on inertial segment OZ.
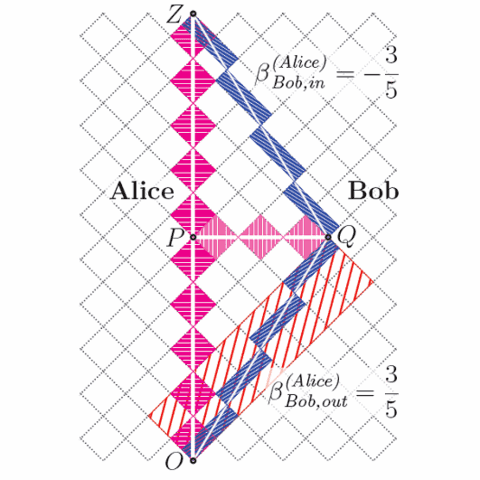
The Clock Effect visualized
Note that there are three inertial reference frames displayed here: Alice, outbound-Bob, and inbound-Bob. This is not easily constructed on the two-observer graph paper or on the hyperbolic graph paper, especially if Bob’s inbound speed is different from Bob’s outbound speed. (Note that the subdivided grid which displayed a glimpse of the unit hyperbola displayed clock diamonds for nine inertial reference frames.)
Final comments
Hopefully, this construction makes it easier to draw, interpret, and calculate with spacetime diagrams. So, let’s draw them! Refer to the paper for details of this method, other textbook examples (length contraction, velocity composition, elastic collisions), and its relation to other methods (radar methods, Bondi k-calculus, Robb’s formula, standard textbook formulas).
Update: 7/18/2016
There is a now follow-up Insight Relativity on Rotated Graph Paper .
Update: 8/24/2016
The last GeoGebra file features a tool to draw clock diamonds along segments so that one can more easily visualize the proper-time along timelike piecewise-inertial segments.
Further Reading
“Relativity on rotated graph paper,” Roberto B. Salgado,
Am. J. Phys. 84, 344-359 (2016); http://dx.doi.org/10.1119/1.4943251
[see also the references within]
“The Clock Paradox in Relativity Theory,” Alfred Schild,
Am. Math. Monthly, 66, 1-18 (Jan., 1959); http://www.jstor.org/stable/2309916
Relativity and Common Sense, Hermann Bondi (Dover, 1962).
“Space-time intervals as light rectangles,” N. D. Mermin,
Am. J. Phys. 66, 1077–1080 (1998); http://dx.doi.org/10.1119/1.19047
“Visualizing proper-time in Special Relativity”, Roberto B. Salgado,
Phys. Teach. (Indian Physical Society), 46, 132–143 (2004);
available at http://arxiv.org/abs/physics/0505134
Relativity on Rotated Graph Paper
Learn About Relativity on Rotated Graph Paper
Learn About Spacetime Diagrams of Light Clocks
Professor of Physics (BS,MS,PhD), Math (BS). Interested in relativity, physics, mathematics, computation, physics pedagogy.


Leave a Reply
Want to join the discussion?Feel free to contribute!