
Evaluate Camera Lens Performance Using an LCD Display
Table of Contents
Introduction
I’ve done plenty of imaging performance testing on a variety of systems, from millimeter wave to UV. Until very recently, such testing required expensive and specialized equipment. Now, with digital imaging (at least in the visible), you can perform the same type of characterization on your camera for free.
Why use an LCD?
All you need is an LCD. LCDs work differently from old CRT displays — they are not raster-scanned, for example. So you can take photos of the display without fear of flicker (which can happen if the shutter speed is not a multiple or fraction of 1/30 s).
Why evaluate lens performance?
There are at least two reasons.
Aperture effects on sharpness
First, lenses do not deliver constant performance over the full range of f-stops. Trained photographers have a saying: “Always use the lens stopped down at least 1 stop from maximum.”
The reasoning behind this bit of lore is that almost all aberrations get worse with a larger aperture (smaller f-stop). Maximum sharpness will be obtained for a limited range of f-stops: smaller f-stops show increased aberrations, while larger f-stops show increased softening effects due to diffraction through a pinhole (the tiny aperture).
Knowing how your lens performs with aperture can help inform your choices when shooting.
Lens-sensor alignment
The second reason is to evaluate the coupling between lens and sensor. Misalignments such as tilt or shift between the lens and sensor can lead to non-uniform focus error problems across the sensor, and being able to diagnose this problem is a useful skill.
Using an LCD as a truth object
Pixel array as the truth object
All imaging evaluation begins from a “truth” object, of which the geometry is completely specified. On the LCD, the truth object consists of the pixel array.
Example: 50/1.8 lens — full frame and crops
Full-frame photograph
Here’s an example, using my ancient 50/1.8 lens. First, the full-frame: this is our LCD TV set on pause — this particular image was used because there are high-contrast features. Note that this image has been manipulated to obscure something really important regarding sampled imaging systems — I’ll get to that later.

1:1 crops and observations
The key is to take an image with as much of the screen in the frame as possible — I am nearly at the close focus distance. The following images are 1:1 crops from the left, center, and right sides: the center of the frame is almost always fully corrected, while at full image height, aberrations are the worst.
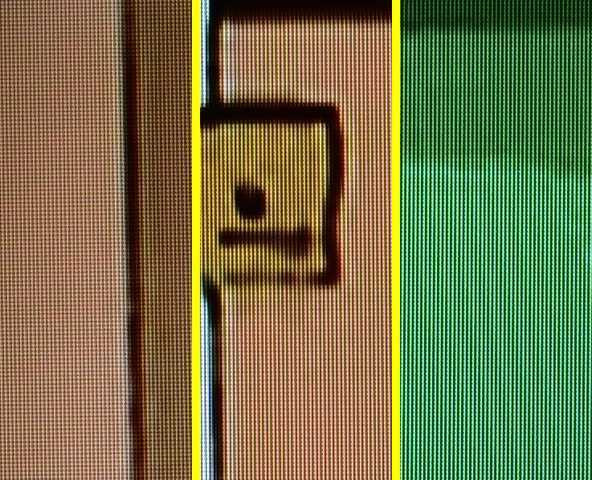
The pixels are all rectangular (no distortion), there is little chromatic aberration (purple fringing), and the entire field is in focus. Field distortion can also be easily measured from these images.
Example: 15/3.5 lens — f-stop comparison
Crop layout
Now, I’ll show some 1:1 crops of images taken using my ancient 15/3.5 manual lens. I’ll combine the fields of view and vary the f/# the following way: the center column is the center field of view, the left column is on the left edge, and the right column is the right edge. The top row was taken at f/3.5, the middle row at f/8, and the bottom row at f/16:
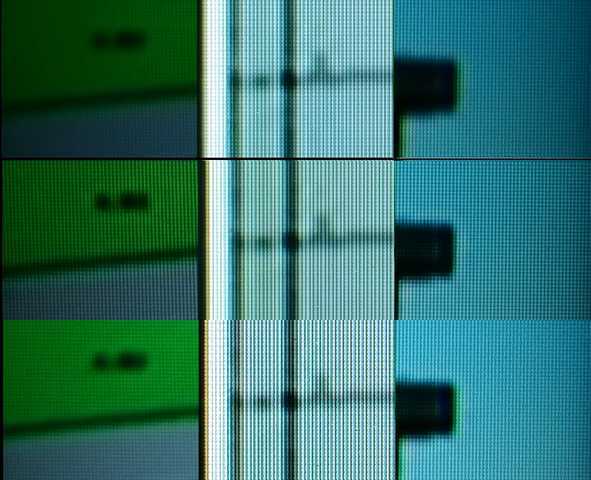
Results by aperture
Now we can see a difference — at full aperture, the pixels are no longer so easily resolved, while at f/8 the pixels remain sharp. There is no obvious distortion, astigmatism, or chromatic aberration. At f/16, diffraction begins to blur the image. So, for this lens, I know I need to stay between f/5.6 and f/11 to maintain maximum lens performance.
Why buy a fast lens?
Reasons to choose fast lenses
So why get a fast lens, if the performance becomes degraded at those low f-numbers? Lots of reasons. First, when I shoot at maximum aperture I’m less concerned with getting a tack-sharp image and instead more concerned with trying to capture a low-light-level scene. Second, when I’m doing astrophotography, even just stopping down 1/3 of a stop greatly reduces aberrations; starting with a very fast lens means I can stop down the lens a bit and still have a fast lens.
Comparing a modern 105/1.4 lens
Test images and f-stop series
But those lenses are at least 40 years old; how does a new high-performance lens compare? Here’s a similar set of images taken with a 105/1.4 lens at f-stops (from top to bottom): f/1.4, f/2.5, f/5.6, f/8, f/16:
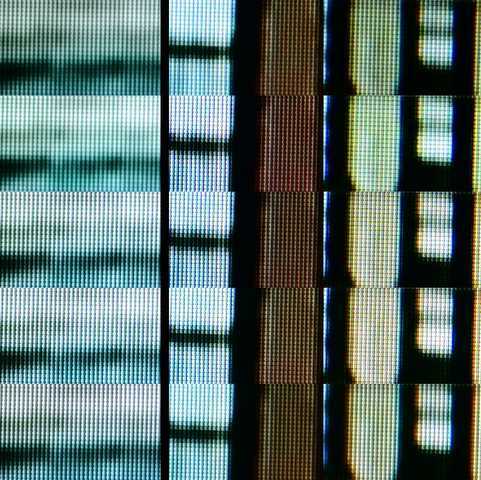
Performance summary
This lens performs very well even at maximum aperture, and the minimum aperture is too large to generate appreciable diffraction blurring.
Aliasing in sampled imaging systems
Moire and aliasing example
Another effect that’s useful to understand in sampled imaging systems is “aliasing”. This occurs because sampled imaging systems are no longer linear–shift–invariant, and the spatial frequencies present in the sensor can interfere with spatial frequencies from the object. Here’s an example of aliasing, caused by re-sizing the full image:

Aliasing as diagnostic tool
Compare this with the first image in this post. For the first image, I pre-blurred the image before downsampling. Here, the LCD pixel size, the camera pixel size, and the display pixel size are (serendipitously) nearly integer multiples of the same size. The phenomenon is identical to “Moire’s patterns” and on one hand, these greatly complicate quantitative measurements of imaging performance. On the other, the “interferogram” that results can be used as a diagnostic tool for distortion and misalignments.
Further work
Next steps
For more in-depth quantitative imaging evaluations, more advanced truth objects are needed. Most of my work involves microscopy, so the truth objects I use are very specialized. The next Insight (whenever I get around to writing it) will discuss these objects and show results.
PhD Physics – Associate Professor
Department of Physics, Cleveland State University


”
Nice job, Andy. Though I admit it is a bit difficult to tell the difference between the pictures to my untrained eye. They look almost identical for the most part.
”
Thanks!
Which images? The 15/3.5 images are clearly different, the others less so.
Nice job, Andy. Though I admit it is a bit difficult to tell the difference between the pictures to my untrained eye. They look almost identical for the most part.